This article will highlight a few of the most popular JavaScript charting libraries. To help you get started, we have attached a sample JavaScript file containing a simple example chart, created in each library.
Note that many of these charts require custom CSS. In these examples, the required CSS has been added to the comments of the JS file.
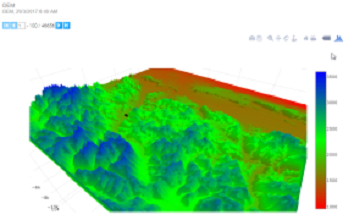
A very powerful and highly customizable charting library. Includes smooth force transitions and animations.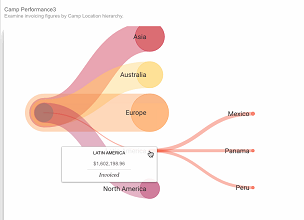
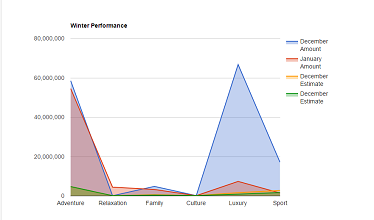
Google Charts: https://developers.google.com/chart/
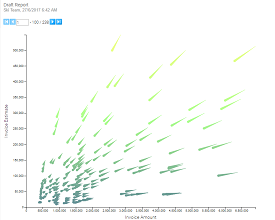
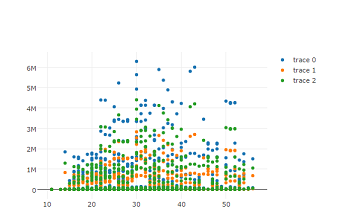
A simple and easy to implement charting library that can be expanded to include many of the more powerful features available in other libraries.
PlotLy: https://plot.ly/javascript/
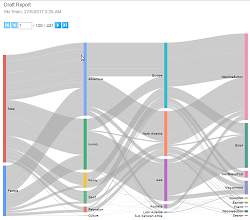
A powerful charting library that provides a large set of pre-built post-charting options such as animation, pan-and-zoom, and brushing.
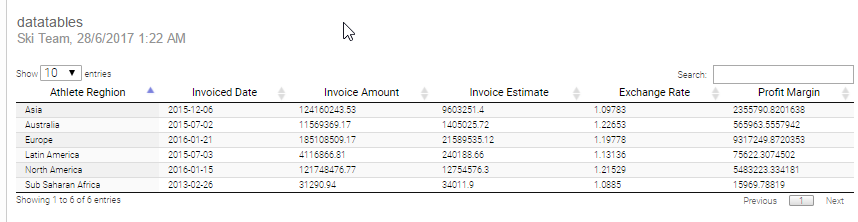
Datatables: https://datatables.net/
Charts don"t always have to be charts! Customize the look and feel of your tabular data, includes searching and on-click actions.
Other libraries of note:
Leaflet: A mapping library that allows for increased customization of geometry display and on-action events.
Fancygrid: A tabular library that allows for embedding charts inline and pre-built styling
chart.js: Another simple charting framework designed for fast charting
Know a library that is not on this list, but should be? Create an "idea" topic and we can add it!