Chart-level aggregations enable you to re-aggregate data within the Chart Builder – that was originally aggregated at the report building stage – to allow metrics to have a chart-specific aggregation.
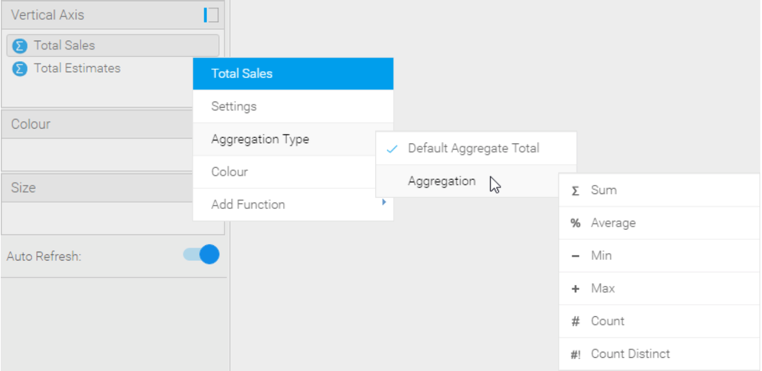
Chart-level aggregations enable you to re-aggregate data within the Chart Builder – that was originally aggregated at the report building stage – to allow metrics to have a chart-specific aggregation.