The KPI Score Card report (see screenshot below) does not ship with Yellowfin installs, though it can easily be re-created.
In order to create this report, you will need;
- 'bsc.csv': This spreadsheet contains the data used in the report.
- 'Scorecard Image File.xml ': This contains the map image, and also includes the org ref codes used.
- 'Direct Link Scorecard Report.xml' : This contains all the reports used for drill-through.
All of these files are attached to this article and can be found at the bottom of the page.
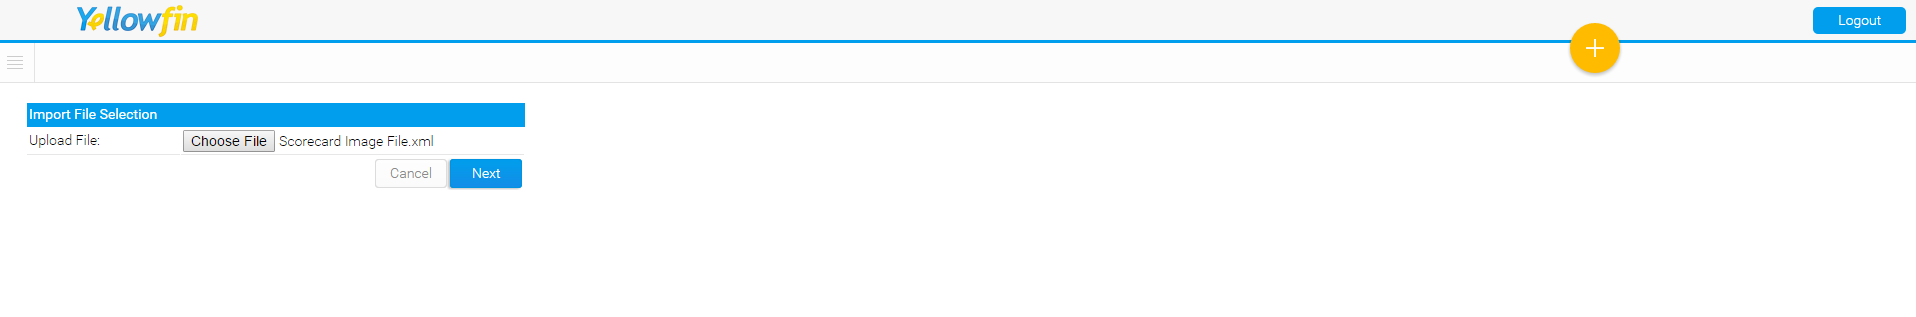
Step 1:
Import the attached 'Scorecard Image File.xml'. Complete this step using the standard Yellowfin importer, not the image importer.
Step 2:
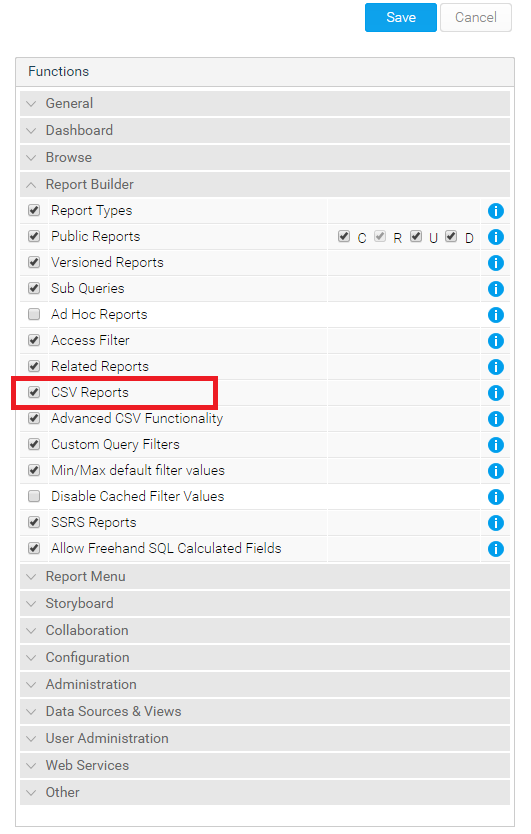
Create a CSV report using the attached bsc.csv file. In order to do this, your login will need to have the 'CSV Reports' Role Function enabled.
Step 3:
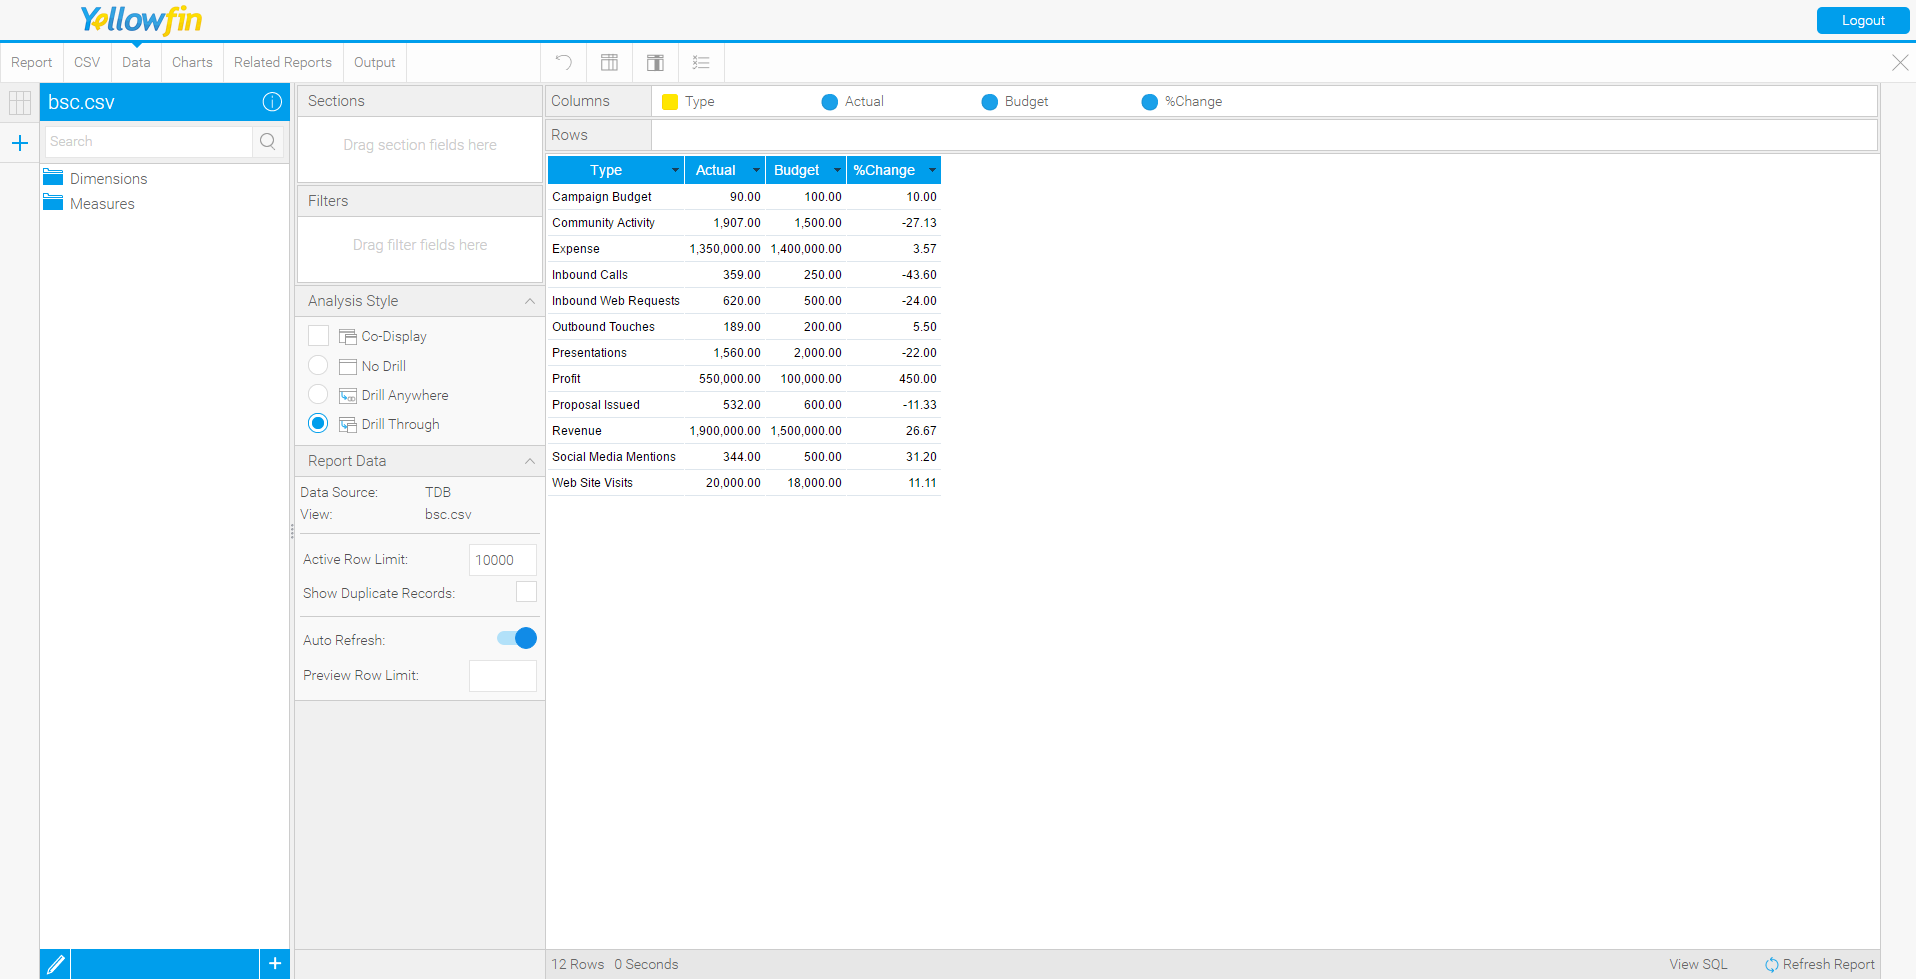
Drag all of the fields into the column builder, and turn off any aggregations that were automatically applied. Modify the Column Settings for 'Type'. Change the Format option to Org Ref Code, and the Reference Type option to Scorecard Categories.
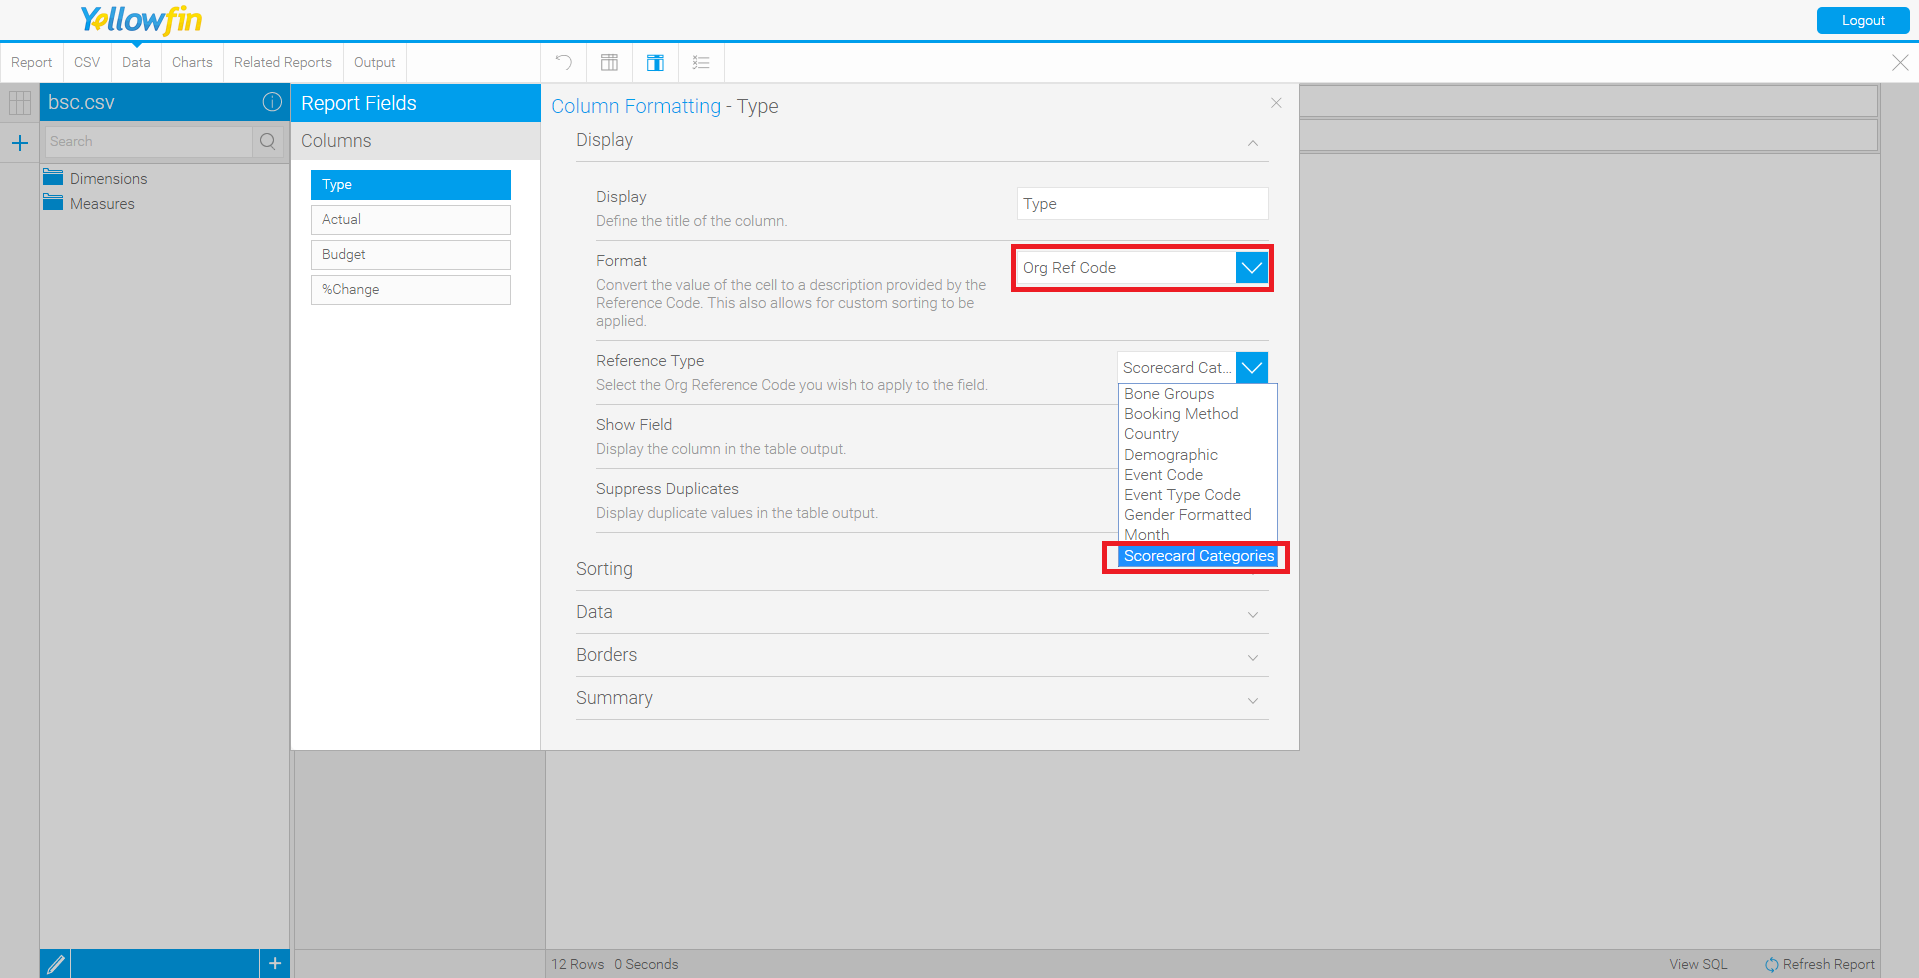
If all of the above steps were completed successfully, your Data tab should look something like this:
Step 4:
Move to the Charts tab, and select Raster Map from the Select Chart pane. Using the Image Manager, select the image titled 'Scorecard'.
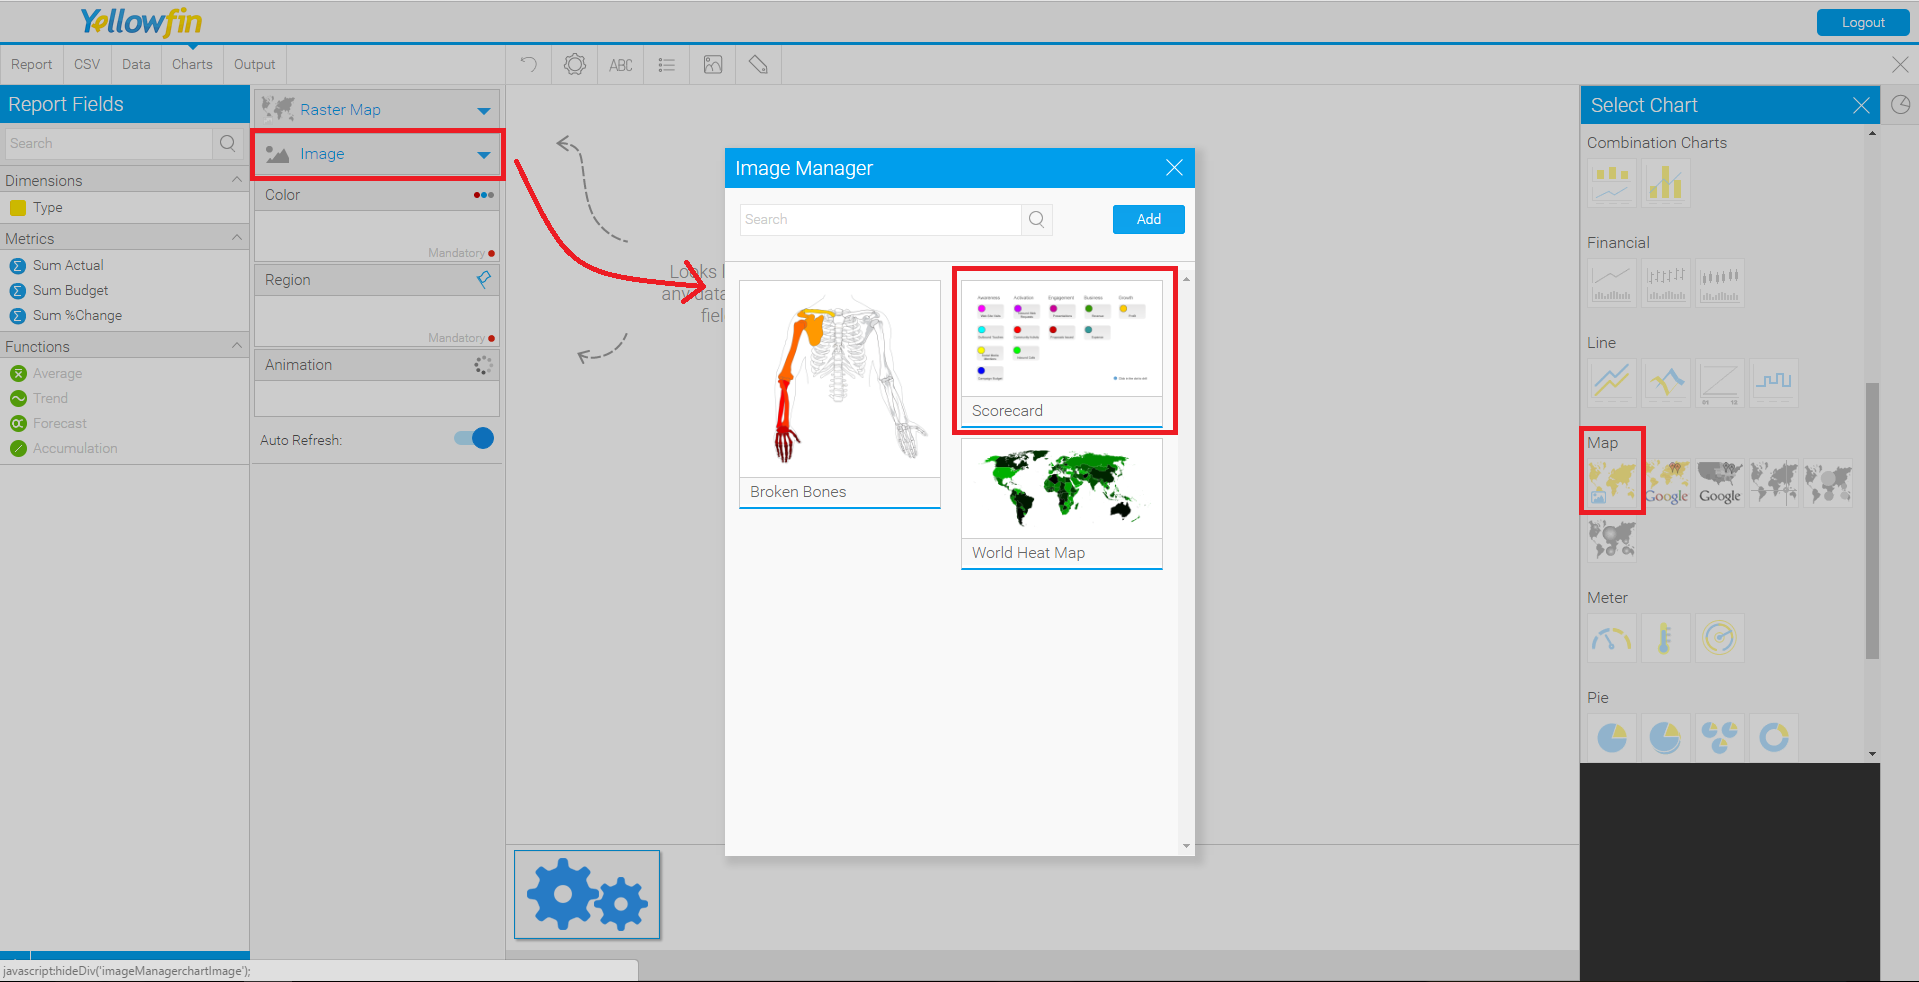
Step 5:
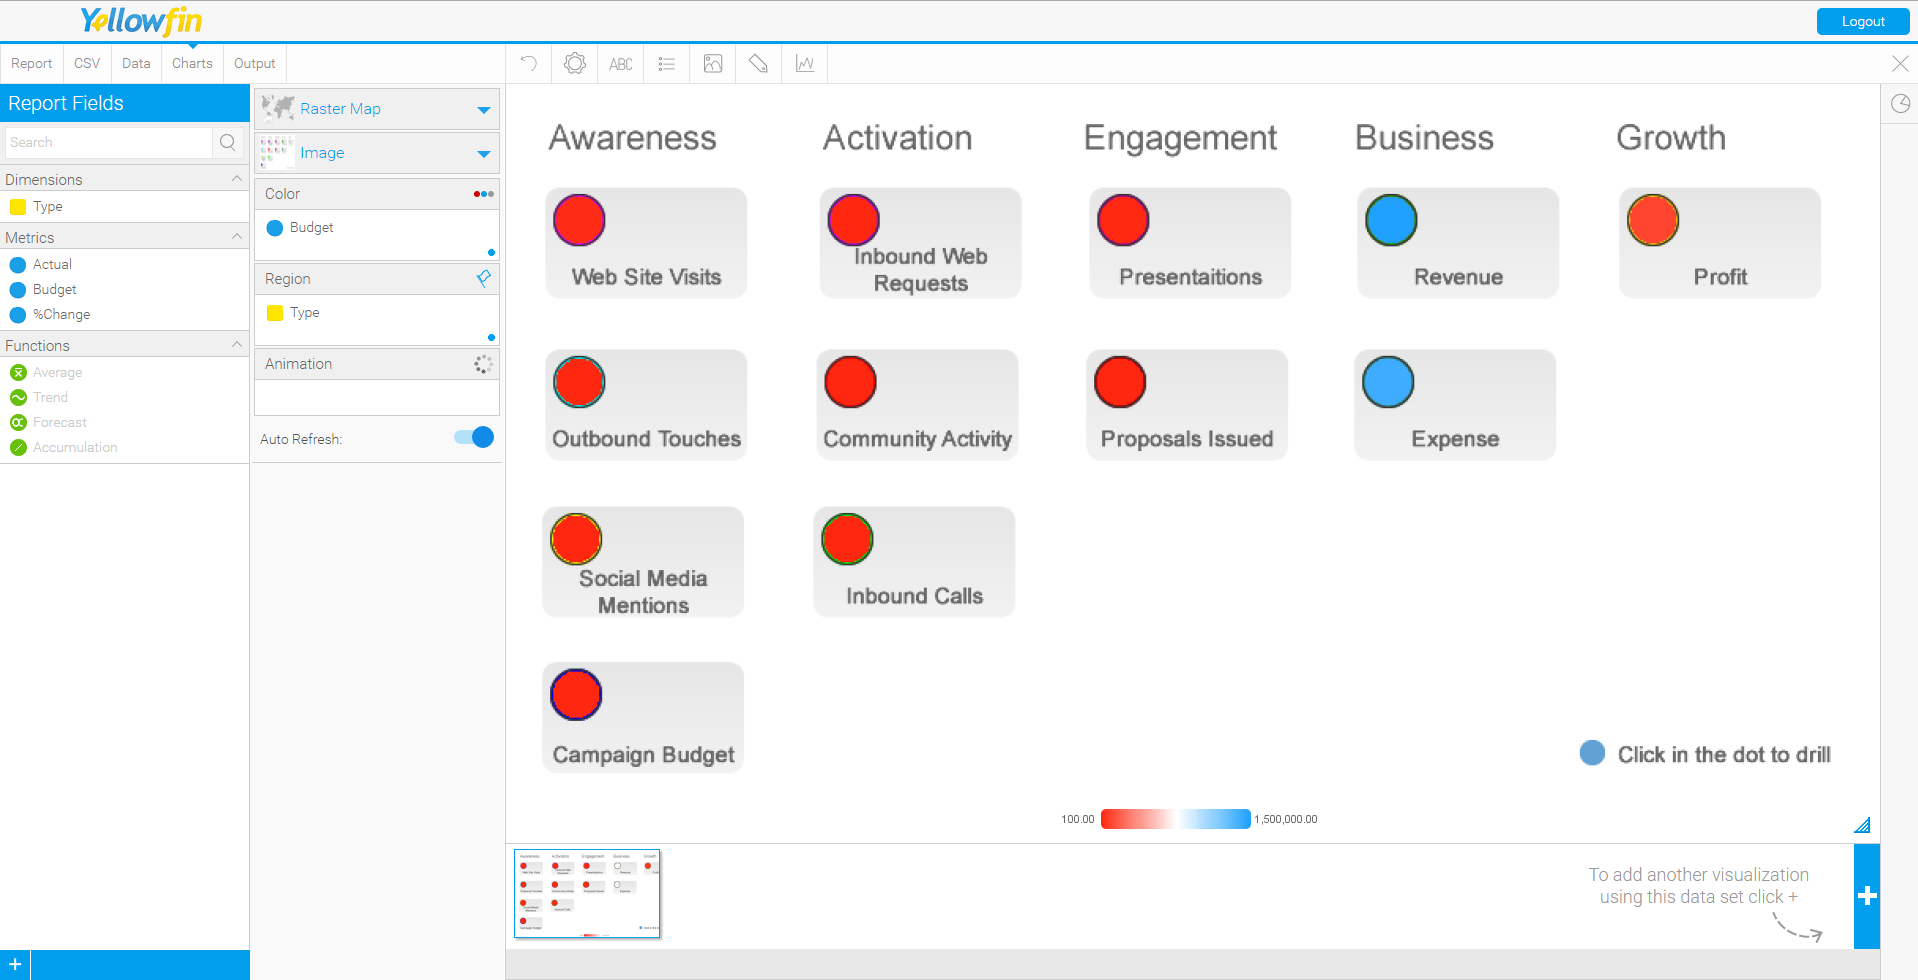
Drag Type into the Region field and Budget into the Color field. After completing this step your chart should look something like this:
Step 6:
Save and Activate the report. You should now have a functioning scorecard report that reports data!
If you would also like to include drill-through functionality, please follow the next steps as we now need to manually link this report to a total of 12 reports (one report for each org ref code). In order to correctly link the reports, you need to note all the org ref codes used and which report it drills to. Example :

As you can see in the above image, the Web Site Visits box uses the Org Ref Code 'Web Site Visits'. If you click on this report it drills to the report 'Web Campaign Effectiveness'.
The table below notes each Org Ref Code and which report it drills to.
| Report Category | Drills to | Org ref code |
| Web Site Visits | Web Campaign Effectiveness | Web Site Visits |
| Outbound Touches | Outbound Touches | Outbound Touches |
| Social Media Mentions | Social Media Mentions | Social Media Mentions |
| Campaign Budget | Campaign Effectiveness | Campaign |
| Inbound Web Requests | Inbound Web Requests | Inbound Web Requests |
| Community Activity | Community Investments | Community Activity |
| Inbound Calls | Inbound Calls | Inbound Calls |
| Presentations | Presentations | Presentations |
| Proposals Issued | Project Proposals | Project Proposals |
| Revenue | Region by Year Revenue | Revenue |
| Expense | Marketing Expense | Expense |
| Profit | Profit Margin - Z Chart | Profit |
Step 7:
Import the attached 'Direct Link Scorecard Report.xml' file. Import ALL reports (you can import these in any report category you like).
Step 8:
Edit the report we just created 'Scorecard KPI Report' and confirm 'Drill Through' is enabled.
Step 9:
Go to 'Related Reports' (Step 2 of the report builder). Locate and drag the report you wish to drill to into the Drill Through section of the page.
Step 10:
Select a report in the Drill Through section to modify its settings. In the settings pane on the right side of the screen and select 'Hyperlink Field = Type', 'Where Field = Type', In list = <Org ref code>.
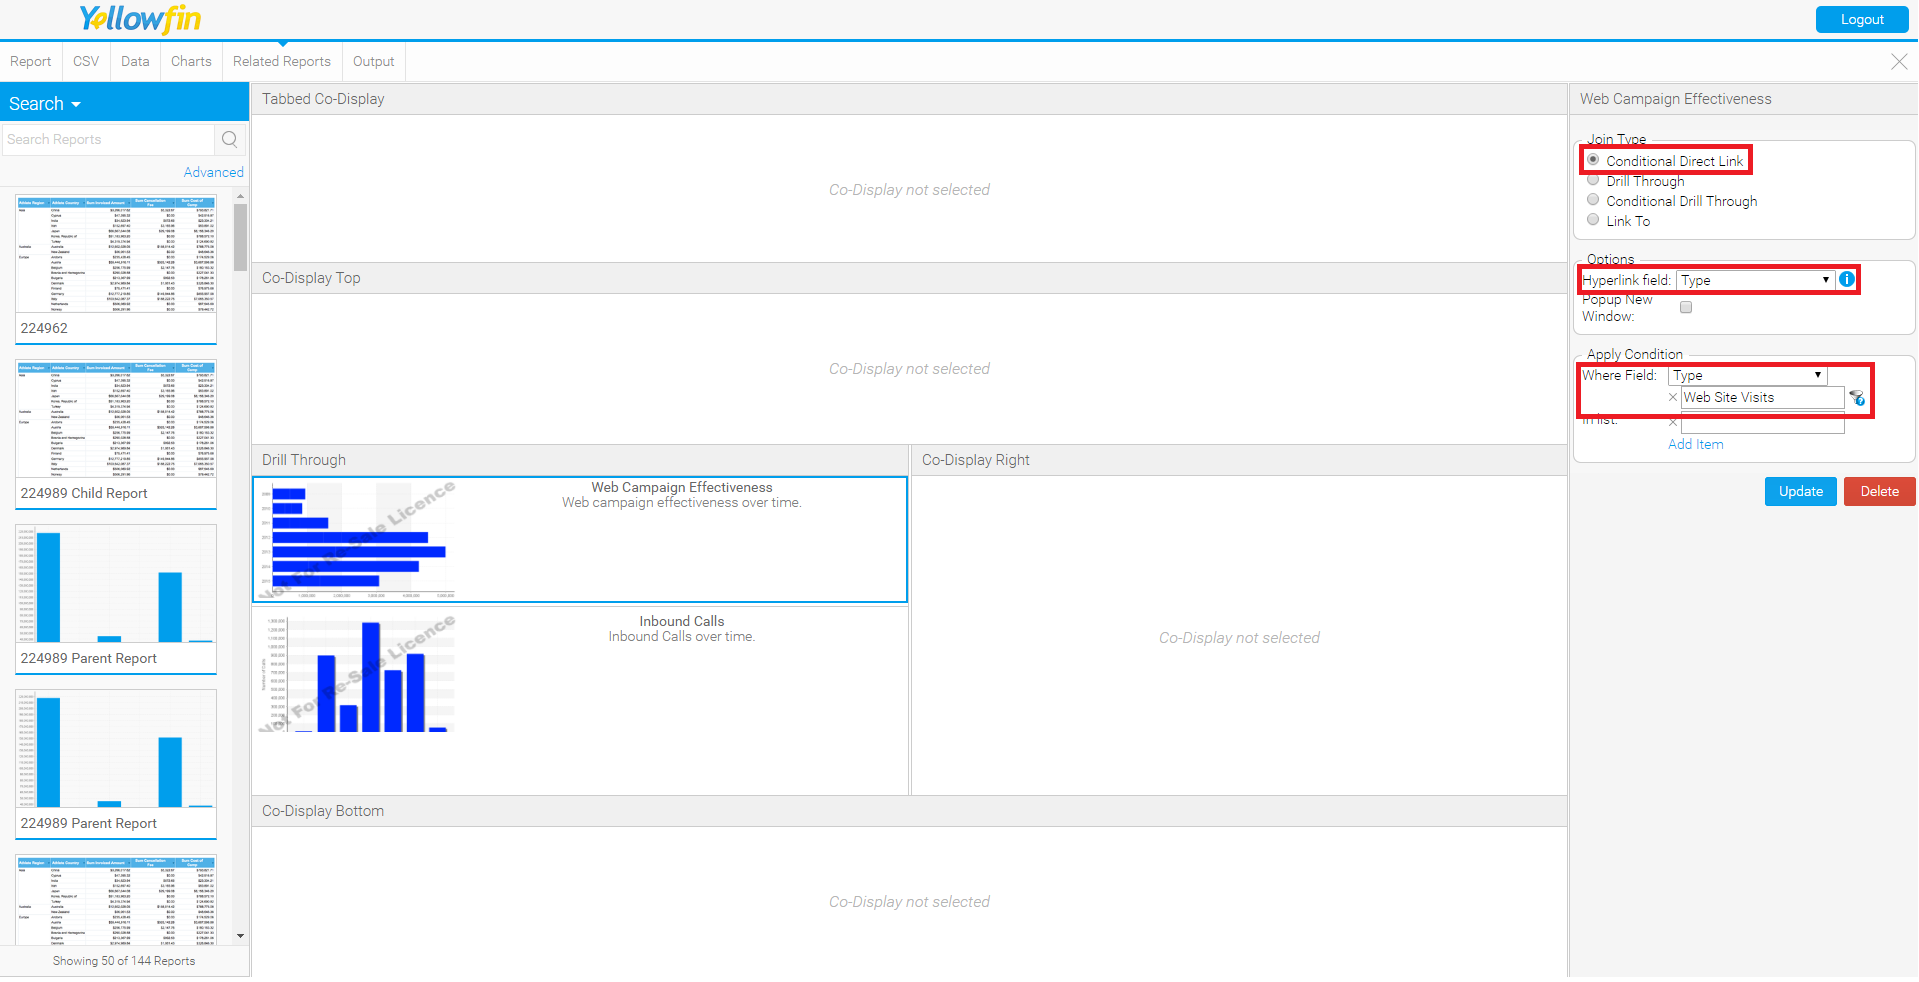
Please use the list mentioned previously to match up the reports to the correct ref code.
Step 10:
Once you have setup drill-through to each report, confirm each drill works as expected and simply save & activate the report.
Please email support@yellowfin.bi if you experience any errors.