Login
Yellowfin Community
Yellowfin Wiki
Yellowfin University
Youtube Channel
Blog
Community
Knowledge Base
Performance
Knowledge Base
Administration
Assisted Insights
Broadcast & Report Exports
Collaboration
Data Sources
Dashboards
Data Transformation
Documentation
Installation & Upgrades
Integration
Performance
Product Change Logs
Report Builder
Security
System Configuration
View Builder
Yellowfin website & Licensing
Related Articles
How do I get the info_threads page and what does this do?
What is InfoThreadRunner and why do I care?
What is Event Caching and how do I adjust the default settings?
Yellowfin Internal Cache Options
Volatile Data Sources - What is it and when do I need it?
Where can I find how much memory is allocated?
How to Learn Report Runtime Via The Yellowfin Configuration Database
Yellowfin Performance Tuning or Monitoring
Yellowfin Performance Analysis Snap Shot Tool
How to Save a HAR file
My Dashboard/Report is slow
Properties
Author
Mahesh Thatipamula
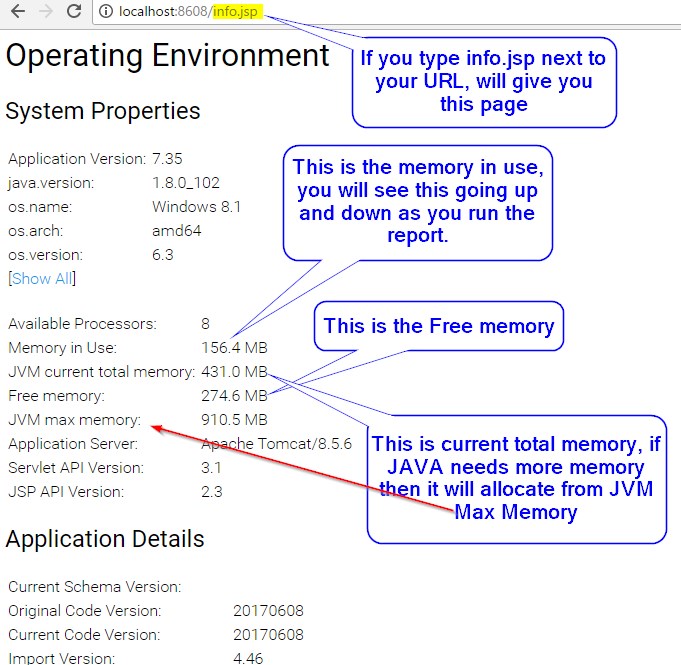
Where can I find how much memory is allocated?
The screenshot below will explain you how much memory is allocated and being used.
Is this article helpful?
1
0
0
Please help us make article better!
Submit
No connection
Real-time notifications may not work