Line Chart Labels
Completed
Hi Guys,
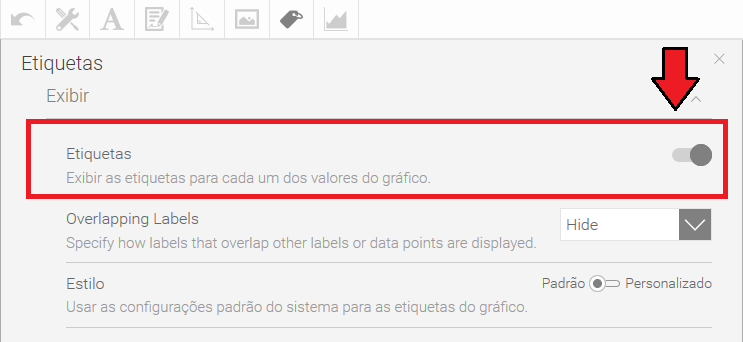
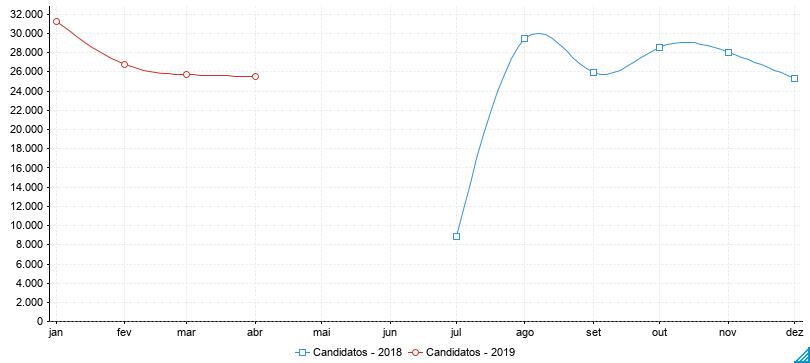
I've created a line chart based on simple values, witch is the month and a metric integer value. When I turn on the labels, nothing seems to change on the chart canvas.
Is there anything left to configure so the numbers will appear?

Thanks in advance.

 The same problem
Hello Renato,
Thanks for reaching out with this question.
It's a little bit confusing but the label function is actually used for each data point on the line within the line chart. See bellow for examples:
Labels disabled:
Labels enabled:
I believe the functionality you are looking for would be under the "axis settings"
Please let me know if this information helps, or if I misunderstood your question.
Regards,
Jared
Hello Renato,
I was able to replicate the behavior we are seeing here in multiple versions of Yellowfin. As such I have raised this behavior to our developers as it seems to me that this is not intended and in-fact defective behavior.
As of right now I am unsure as to why this behavior is happening but I will keep this post updated with new information as it becomes available to me.
Thanks,
Jared
Replies have been locked on this page!