
Category
Report Builder
Product Version
7.4
Scroll bars obscure data on dashboard table view
Resolved
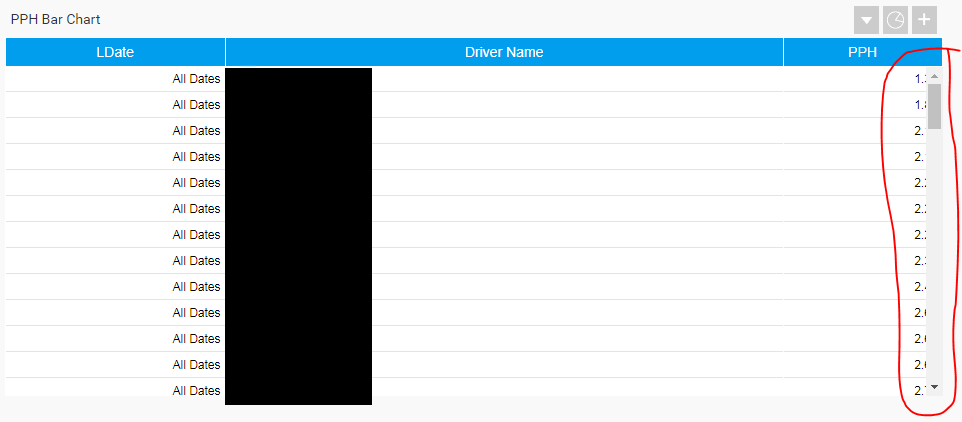
I have a bar chart on my dashboard. Above the chart (when hovering) there is a button to toggle the report to display the table instead of the chart. When I hit this toggle I am shown the table for the report, but a scroll bar appears which obscures the data. The positioning of the table should adjust for the presence of a scroll bar so that it doesn't cover up the data...
Files:
ObscuringScroll...
 The same problem
Hi Stephen,
Thank you for reaching out. Reports on dashboards are dynamically sized, not pixel perfect, so sometimes this causes unfortunate consequences upon displaying reports. I think a good thing to try would be to increase the overall dashboard width from the admin console. You can accomplish this by heading into Administration > Content Settings > Dashboard Settings > Display Settings > and increasing Default Dashboard Width to a higher value. Maybe just try increasing by 50px or 100px at first. You may have to play around with the value a bit to make it look right. This is the screen I'm referring to, so you have a visual reference:
Please let me know how this works for you and whether you have any further questions.
Regards,
Mike
Thanks for your response Mike.
Your suggestion did not fix the problem. If you look at my original screenshot, you will see that the data presented in the table is not even taking up half of the currently available table width, so I'm not surprised that giving it even more width didn't solve the problem.
If I switch to the table view and refresh the page, the table is resized correctly when it loads. The problem only occurs when switching from chart view to table view.
BI software is supposed to enhance visibility into data. A UI bug that is literally obscuring my data certainly leaves a bad taste in my mouth.
Hi Stephen,
Thanks for your response. I think we've stumbled upon a bug here. I am successfully able to replicate what you are seeing, and it seems that everything works as expected until after you toggle to chart, then back to the report.
When I first open dashboard, pre-toggle:
After toggling to chart, then back to table:
I completely understand your frustration here. It should be noted that we are doing a complete redesign of our dashboards for Version 8, which is expected to be released later this Summer. In the meantime, there is also the possibility of hiding the scrollbar entirely, if that's something that could work for you: How to Disable Scroll Bar on Dashboard Portlets.
I've gone ahead and raised this as a defect in our internal bug tracking system. Any potential updates regarding this matter will be posted here.
Regards,
Mike
Sometimes products which have been newly redesigned and released have more bugs than older versions.
Has anything been published that describes what is included in this redesign? Something to get users excited about what's coming?
We have a trial license and are shopping for a BI platform now.
Sometimes products which have been newly redesigned and released have more bugs than older versions.
Has anything been published that describes what is included in this redesign? Something to get users excited about what's coming?
We have a trial license and are shopping for a BI platform now.
Hi Stephen,
I definitely understand this point. A lot of focus of the dev team is going towards making for a smoother upgrade process. As of 7.3, the upgrade process at Yellowfin has been going much smoother in general, and we are certainly working to ensure this remains the case, at the very least, and at best, to make it better. Support is also always here to assist with issues relating to upgrading. The intention with Version 8 is to have Dashboard's be fully customizable, including having a canvas similar to that of our multi-chart canvas when building reports. Nothing is published as of yet about this redesign unfortunately, as it is still at least a couple months away from being completed. We don't know exactly what features it will contain due to this fact.
Regards,
Mike
Replies have been locked on this page!