
Category
Report Builder
Product Version
7.3
Line Graph problems
Completed
Hi Support,
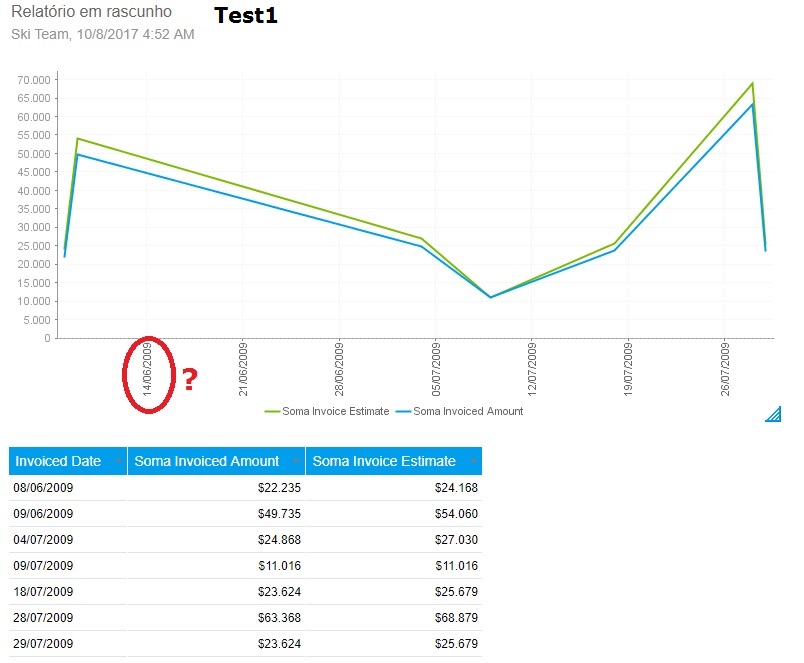
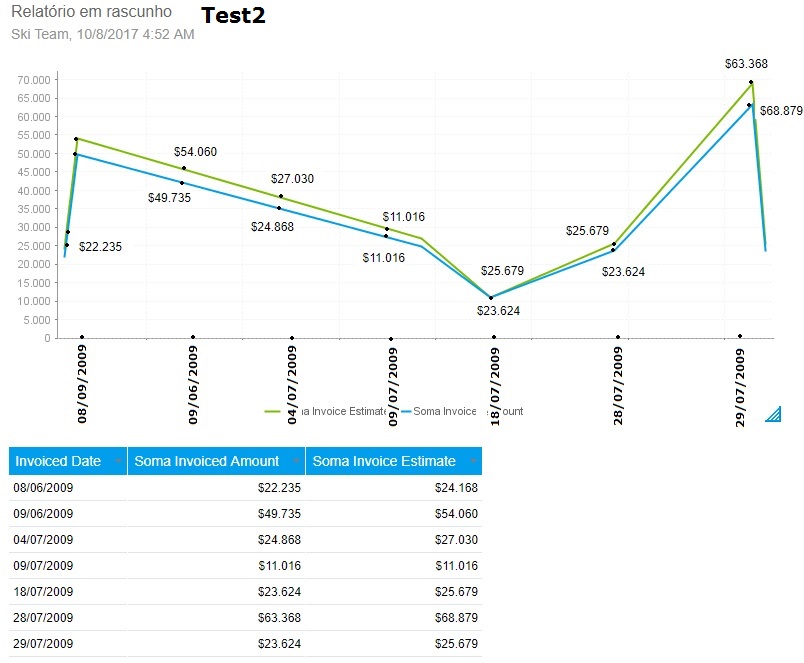
I did a Graph test1 using the Line format, but I´d like to know how can I get a Line Graph as test2?
The date in table is not the same in the graph and I can not find a way to show the label as test2.
If not possible to use this format in line graphs, please let me know what is the other graph format to be similar to the test2?
 I like this idea
Hi, I found a way changing to Combination Charts, but I did not find the labels.
Hi, I found a way changing to Combination Charts, but I did not find the labels.
Hi Arthur,
Thanks for sending this in. It looks like you've got this mostly figured! I was going to either suggest a regular Line Chart with multiple metrics on it, or a Combination Chart with multiple series set to Lines.
As for putting labels on the points, this is a feature that is not currently a part of Yellowfin, but a couple of clients have previously requested it be added. As such, we have it raised in our internal system for the development team to look at and address, with the ID of YFN-5304. In the meantime, the tooltips that are present on the Line/Combination charts will have to suffice for the labels :/. I'm going to switch the status of this question to 'Idea Logged', so be sure to check back here for updates!
Thanks,
-Conner
Hi Arthur,
This Idea has been completed and will be a part of our upcoming April releases, expected between the 15th and the 20th.
Thanks,
Ryan
Hi Arthur,
This Idea has been completed and will be a part of our upcoming April releases, expected between the 15th and the 20th.
Thanks,
Ryan
Replies have been locked on this page!