Idea for improvement - Dynamic scale
Dear Yellowfin-Team!
During my work for one of our customers i had an idea for an improvement of the charts of a report.
My idea is a dynamic scale for the graphs which can be controlled by an object.
Example:
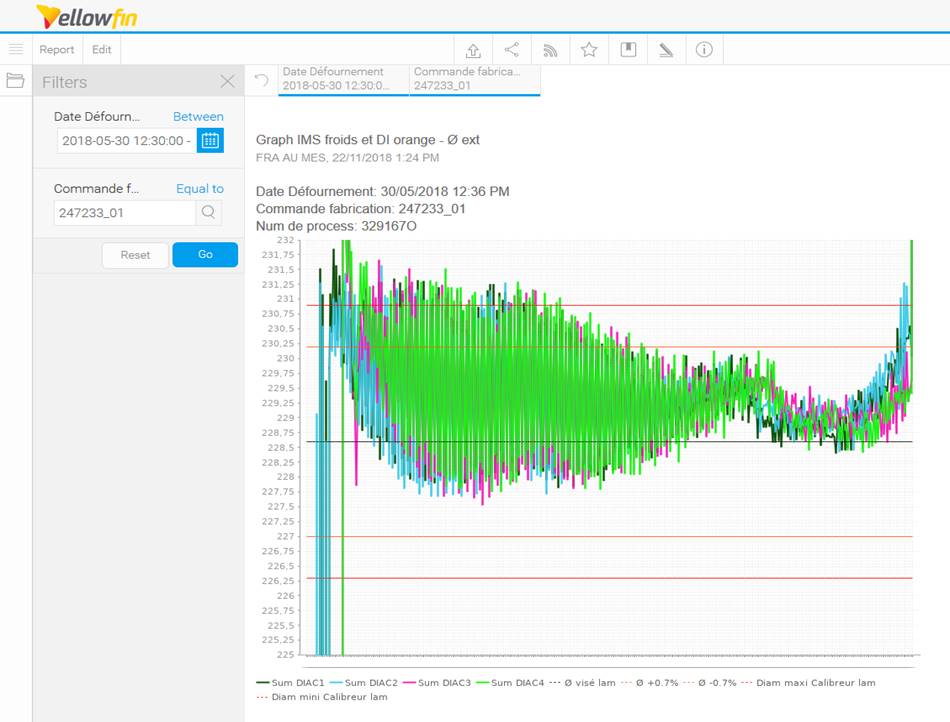
In the picture below you see a graph of measures (diametres) coming from a machine producing tubes.
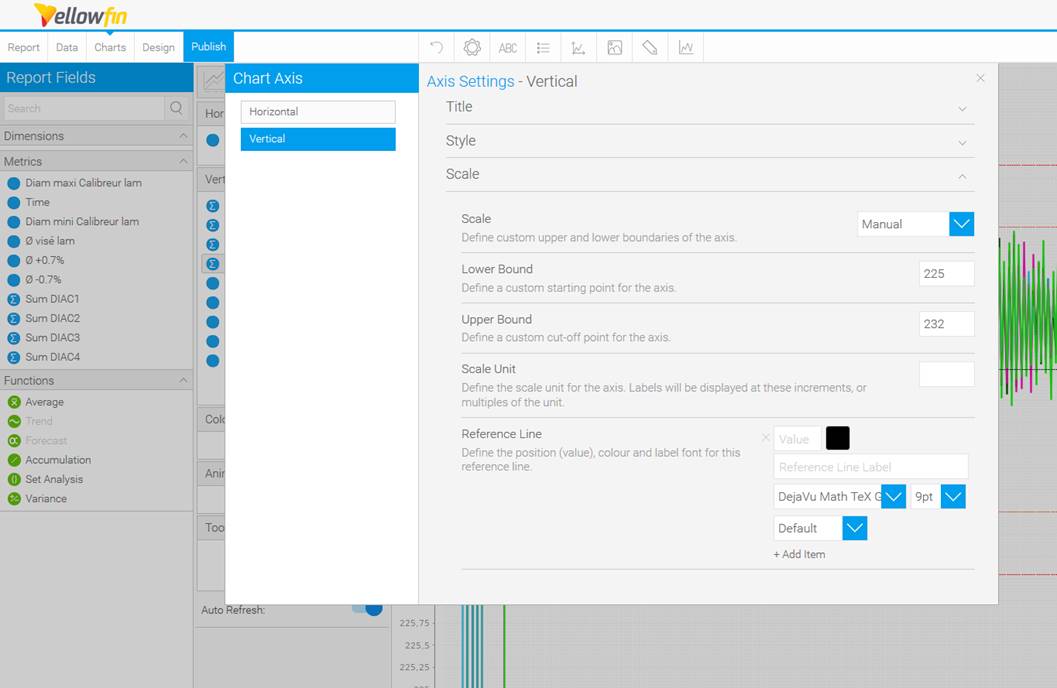
This graph had to be set up manually, because the automatic mode would not work because of high initial values, so that the curves the customer focusses on are to small and relevant changes in the data can not be seen. The range-mode would have quite the same effect.
So the range had to be set by hand, which works good as long as the data doesnt "leave" the frame.

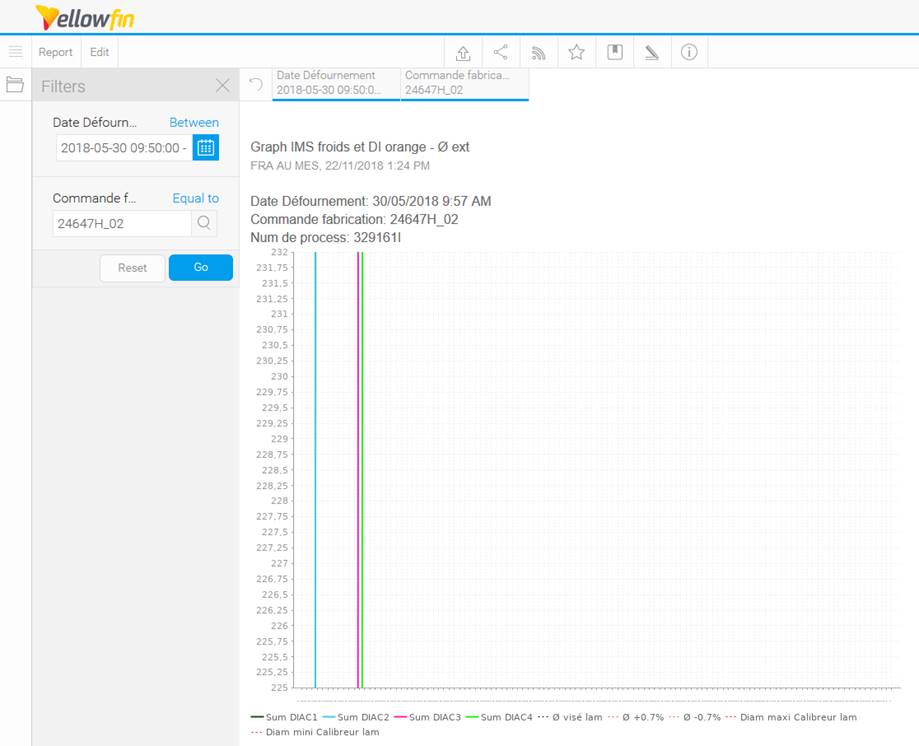
So in the picture below you can see what i mean. Same report but another production number with other tubes with other given diametres. The relevant data can not be seen (curve cluster).

So my idea would be, that you can set the scale of the graph around the value of an object, in this case "Ø visée lam", which is the set value for this production batch of tubes. A fourth option in the pulldown-menu, where i could set "Ø visée lam" as set value and two fields for the upper bound "plus X units of set value" and lower bound "minus X units of set value".
Effect would be, that when the customer changes the production number and the given diametre changes, the scale of the graph would change with the set value of the production batch and show the curve cluster around the set value.

This would be a really fine improvement which could be intresting to other customers as well.
With best regards!
Christoph Seiler
 +49 2561 9303-782
amexus Informationstechnik
Tel.: +49 2561 9303-0
GmbH & Co.KG
Fax: +49 2561 9303-30
Von-Braun-Straße 34
48683 Ahaus
Board of Directors: Jörg Tomse, Andreas Veltman, Stefan Nacke Court of Law: Coesfeld HRA 2685 Liable body: amexus Informationstechnik Verwaltungs GmbH, Coesfeld: HRB 3901 amexus provides fully fledged IT solutions in the areas of infrastructure and related services, business solutions, telephony, standard software applications, consulting, and software development.


 I like this idea
Hi Christoph,
Thanks for reaching out with your idea!
There may be an alternate way to achieve what you are attempting in the software's current form. There is the option to create filter groups at the view level, where you could control the size of your chart axis by filtering the outlier data.
To confirm what you are actively seeking in this case though, you would like to see an "object-based axis filter" (no pun intended) that adjusts the chart axis based on defined upper and lower bounds settings for the object, correct?
Hi Eric!
Thank you for the fast response!
Maybe the first approach could work, but i dont´t know if we get in trouble with this filter, when the same objects are needed in other reports without any filtering.
Yes, exactly, object-based axis filter would be the right definition for what i am looking for. An option like this would be awesome.
Regards
Christoph Seiler
Von: Support Queue <support@Yellowfin.bi>
Gesendet: Freitag, 18. Januar 2019 21:46
An: Seiler, Christoph <cseiler@amexus.com>
Betreff: New Comment in "Idea for improvement - Dynamic scale"
Hi Christoph,
Thanks again for reaching out. I have created a developer enhancement request based on your idea.
The development task ID has been attached to this ticket, and updates will be provided here as they are available.
I've updated this ticket's status to Idea Logged. Feel welcome to reply to this ticket with related inquiries.
Regards,
Eric
Replies have been locked on this page!