Add Chart Brushing/Filtering in Stories
Idea Logged
Hi,
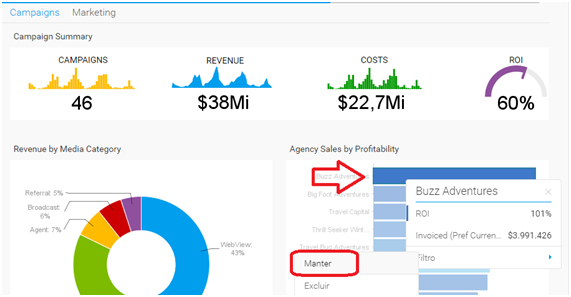
I verified that in the Tab below is possible to use the filter in "Buzz Adventures" and apply to the other graphs in the same Tab:

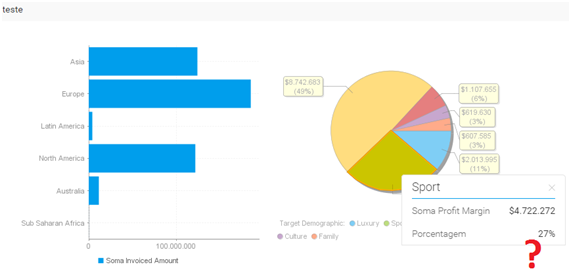
But, if is used a report with two graphs in the same report (multi charts) this filter is not possible anymore.

Please, let me know if is possible to use this kind of filter in multi-charts ?
-- Grato & Abraços, :. Arthur Jalmusny :. Skype: arthurjal :. +55(51)99985.6883 :. arthur@yellowfin.com.br :. http://www.yellowfin.com.br :. Making Business Intelligence easy

 I like this idea
Hi Arthur,
Thanks for reaching out. You can use Multi-Charts on the Dashboard in much the same way you would other charts, it's just that if you bring in a new chart to the dashboard, which if there's now a Multi-Chart report in the Campaign Analysis Dashboard, then this had to have been done, you then have to setup the filtering, links and brushing in the Dashboard's Analytic Setup section:
You can reference our Wiki entry on Analytic Setup for more information here and please let me know if you have any further questions.
Regards,
Mike
Hi Mike,
I did a test again and I´d like to click in some graph in the multi-chart and apply the filter or selection in all objects in the same dashboard.
I did the Analytic Setup, but I can not see the "Filter" button to select the "Buzz Adventures" in the multi-chart.
Hi Mike,
I did a test again and I´d like to click in some graph in the multi-chart and apply the filter or selection in all objects in the same dashboard.
I did the Analytic Setup, but I can not see the "Filter" button to select the "Buzz Adventures" in the multi-chart.
Hi Arthur,
It turns out I was headed in the wrong direction in my initial response. After some testing, I did get this to where I can see what you're seeing, so I did some further research and I found that clicking the chart itself and choosing Filter is actually a part of the Chart Brushing feature, a feature which allows users to restrict results in their chart by choosing to Include or Exclude certain areas. I erroneously thought Chart Brushing only referred to filtering by clicking and dragging and didn't realize that also included clicking on Filter in the chart as well.
If you reference our Wiki entry on this feature you'll see that there's a Limitations section, which states the following:
Chart brushing will not be available in the following cases:
As such, this functionality does not currently exist in Yellowfin.
If you can describe in detail your use case and requirement for using Chart Brushing with a Multi-Chart Report on a dashboard instead of using a separate report/chart on the dashboard, then we can change this ticket to a public Idea item in the Community if you wish, and then submit an internal enhancement request to our dev team.
Let me know what you think.
Regards,
Mike
Hi Arthur,
I just wanted to check in and see how things are going with this.
Regards,
Mike
Hi Arthur,
I just wanted to check in and see how things are going with this.
Regards,
Mike
Thanks! This was a question from a company that use Power BI and they are evaluating Yellowfin. They did the same dashboards similar to their dashboards in Power BI using Yellowfin multi-charts feature, but they can not link others objects. I told them that they can copy the object and use as a separate reports in order to link and I am helping with others questions about comparison with Power BI.
Thanks! This was a question from a company that use Power BI and they are evaluating Yellowfin. They did the same dashboards similar to their dashboards in Power BI using Yellowfin multi-charts feature, but they can not link others objects. I told them that they can copy the object and use as a separate reports in order to link and I am helping with others questions about comparison with Power BI.
Hi Arthur,
Thanks for the info. That being the case I'll go ahead and close this out then, but if you have any further questions or concerns on this, please don't hesitate to reach back out.
Regards,
Mike
Hi Arthur,
Thanks for the info. That being the case I'll go ahead and close this out then, but if you have any further questions or concerns on this, please don't hesitate to reach back out.
Regards,
Mike
Hi Mike, The customer want to use the same functionality or selector in Stories linking with other graphs.
They also want to use the selector in tables in a table or cross-table
Is it possible or there is a plan to develop?
Hi Mike, The customer want to use the same functionality or selector in Stories linking with other graphs.
They also want to use the selector in tables in a table or cross-table
Is it possible or there is a plan to develop?
Hi Arthur,
If I'm understanding correctly, what you're looking for here is an enhancement to add an Analytic Setup section as there is on a dashboard, so that you can brush one chart and filter results on other charts in the story?
In addition to that, you'd also like to be able to filter table results contained in a Story within the Story itself?
Please let me know if this is correct.
Regards,
Mike
Yes! They want to click in the graph in the story and filter others graphs in the story.
The other question is about tables: They want to use this feature of selection using a mouse in a table and filter other objects in a dashboard as there exist in the graphs. See the Power Bi sample:
Yes! They want to click in the graph in the story and filter others graphs in the story.
The other question is about tables: They want to use this feature of selection using a mouse in a table and filter other objects in a dashboard as there exist in the graphs. See the Power Bi sample:
Hi Arthur,
Great! I've gone ahead and submitted an enhancement request and changed your ticket to an Idea item to track the first idea, which is it add something like the analytic setup in dashboards to allow for chart brushing/filtering in stories.
As for the second Idea, if you'd like, please submit a separate Idea ticket in our Community with further details, including what this feature is called in Power BI so that this can be referenced and considered further.
Any potential updates regarding this first Idea will be posted here.
Regards,
Mike
Hi Arthur,
I've received feedback from the dev team on this. We're curious about the use case for requiring this functionality.
It was stated that "Linking reports isn't something we intended to allow people to do in Stories because it's meant to be a story about mostly static data," so we're looking for a rather compelling reason that this would be beneficial when this can mostly be done already in Dashboards. As such, please further detail this use case to us.
Thanks,
Mike
Replies have been locked on this page!