
Category
Chart Builder
Product Version
8.0
Dynamic Reference Line in charts
Completed
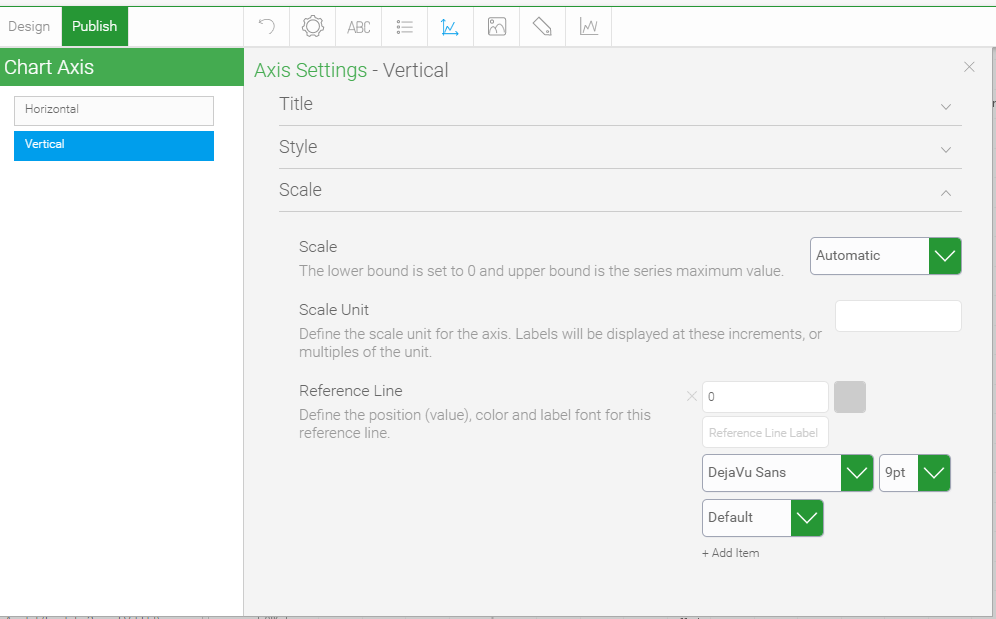
Hi guys, I am working with scatter plots recently and I use reference lines. (Please see the ss)
Currently these reference lines are static, hard coded. We need to give the exact values for it.
However, it would be great to have a dynamic reference line whose value change according to a specific data point.
For example, in my dataset, I have average values as another data point where I would like to use as a reference line. So, instead of having a static reference line, I would like to have my average values as a reference.
Do you think it is a good idea?
Files:
Reference line.PNG
 I like this idea
Hi Vefa,
I hope all is well,
I have been looking at this further and I believe we already have a similar (if not the same) idea raised, please see this link. Let me know your thoughts on this.
Regards,
Mark
Hi Vefa,
I hope all is well,
I have been looking at this further and I believe we already have a similar (if not the same) idea raised, please see this link. Let me know your thoughts on this.
Regards,
Mark
Hi Mark, that request is similar but not the same except the reference line being dynamic.
I would like to have it referenced to a data point in the table on the other hand, they wanted to have it referenced to a column in view, as far as I see.
But yeah, the idea is the same, we would like to have dynamic reference lines :)
Hi Vefa,
Thank you for letting me know... I think going forward if you can follow/like that idea ticket and make a comment to request how you would like it to work that would be great. I will then update the enhancement that sits with our development team to suit your needs.
Does this sound good Vefa? Let me know.
Regards,
Mark
Hi Mark, thanks. I added my comment to the previous topic.
Hi Mark, thanks. I added my comment to the previous topic.
Hi Vefa,
Thank you, this should have with the push to get this looked at by our development team. Going forward I will mark this as Completed.
Have a great week ahead.
Regards,
Mark
Hi Vefa,
Thank you, this should have with the push to get this looked at by our development team. Going forward I will mark this as Completed.
Have a great week ahead.
Regards,
Mark
Replies have been locked on this page!