
Category
Chart Builder
Product Version
8.0
Date slider not working with numeric display
Resolved
Hi,
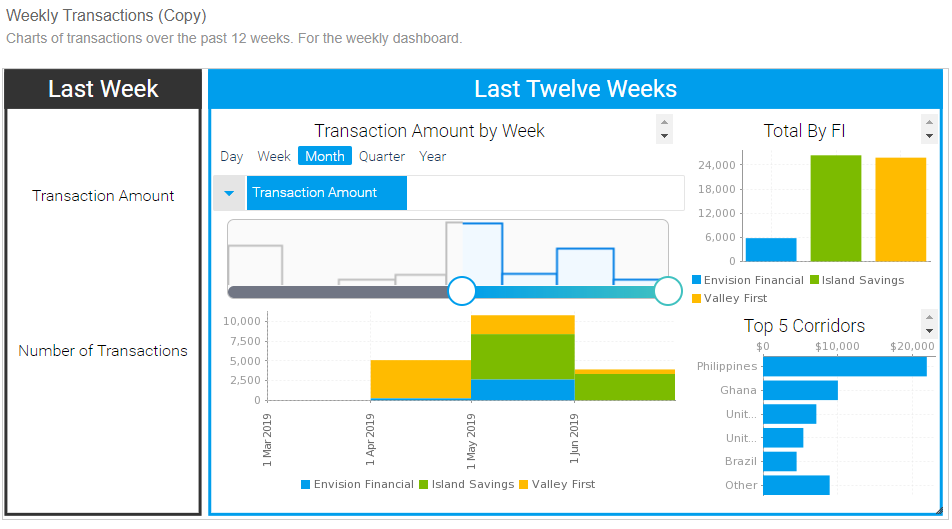
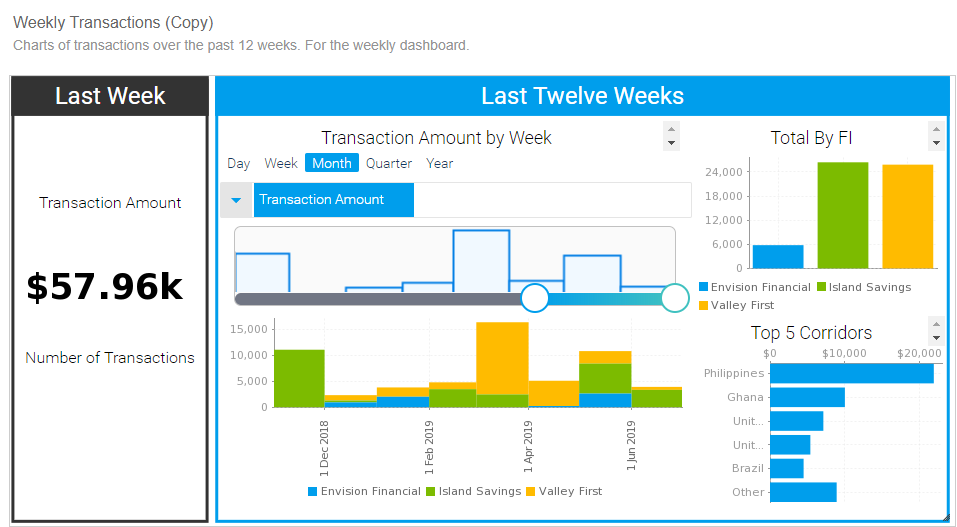
I have a bar chart of transaction amount over time. I put a date slider on it, and it works as expected.
I made a numeric display chart to display the total transaction amount over the time period displayed in the bar chart. As soon as I put the numeric display on the design canvas, the date slider no longer works properly. No matter what range I select in the slider, the bar chart and numeric display show data from the full time range.
See screenshots attached.
David
 The same problem
Hello David,
Thanks for reaching out with your issue. I was able to replicate said issue, and it appears to be defective behavior. I have have raised this for review by the Development Team, and will keep you updated with further information as it becomes available.
There are a couple of ways we could work around this. My recommendation would be to create and publish the two charts in separate reports, and place them on a Dashboard to display them together. The other potential work-around if your requirement is to have them on the same report, I would look into making a Co-display report.
I understand this may not be the news you were hoping for and I am sorry for any inconvenience this may be causing. Please let me know if either of these solutions work for you.
Thanks,
Jared
Replies have been locked on this page!