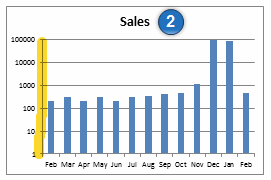
Add logarithmic scaling for charts
Not Planned
For data sets with large value ranges there aren't really many options to display them in an easily read fashion.
It would be nice to have a Log scale option for the axises:


 I like this idea
Hi Tessa,
I've logged this as an enhancement request in our internal tracking system. Any potential updates regarding this matter will be posted here.
Regards,
Mike
Hi Tessa,
I've logged this as an enhancement request in our internal tracking system. Any potential updates regarding this matter will be posted here.
Regards,
Mike
Hi Tessa,
This has been marked as 'Not Planned'. Here's the official update: "we will be doing a major upgrade to our chart infrastructure next year. It will be easier to include new chart types and options with a bit of coding.
So closing this one for now."
Please don't hesitate to reach out with further questions or concerns.
Regards,
Mike
Thanks for the update, Mike - appreciated!
Thanks for the update, Mike - appreciated!
Hi Tessa,
You're welcome!
Regards,
Mike
Hi Tessa,
You're welcome!
Regards,
Mike
Replies have been locked on this page!