Tracking how many times a dashboard was run in a month
Answered
Hello,
A client organisation has wanted to see the amount of times the dashboards are used. Since I would want to show the numbers by month, is the best way to find this to count the events with the "dashboard" event code or is there something else I should be looking at?
All the best
Siim N

 The same question
Hello Siim,
We have an 'Audit Content' Plugin available on the market which contains 5 views, 3 dashboards and a set of reports to explore your system usage. I have this installed in my local YellowFin instance and it allows me to see dashboard useage by day, month, year, etc (see below).
There is more detail regarding this plugin on our wiki.
Please let me know if you have any further queries regarding this question.
Kind regards,
Nathan Goddard
Hello Siim,
Hope you are well.
Just checking in to see if the plugin I suggested has what you where looking for or if you have any further questions regarding this?
Kind regards,
Nathan Goddard
Hello Siim,
Hope you are well.
Just checking in to see if the plugin I suggested has what you where looking for or if you have any further questions regarding this?
Kind regards,
Nathan Goddard
Hello Siim,
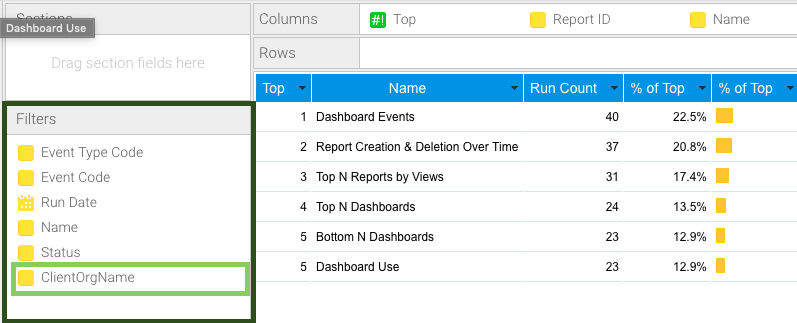
I have modified the 'Yellowfin Usage Audit' view to include two additional table which pull in the users linked ClientOrg - Name. This has then allowed me to add filters to existing reports provided in the 'Audit Content' package and therefore the Content > Dashboard reports can be filtered by this field. I have tested this on the 'Top N Reports by Views' (Seen Below)
This filter can then be added to any of the reports within this Dashboard or any new reports you create using this view.
I have attached an export of the view I have modified which also shows the change I have made to this report. I recommend importing this into a development/testing environment first if available. From here you will be able to see the additional tables, joins, conditions and the calculated field required to handle NULL values in the ClientOrgName (as the default client is Null). (Shown Below)
Additional Tables
Calculated Field
ClientOrgName added as Filter
Please note that there are limitations to this, the most important being that if a user is assigned to multiple clientorgs then selecting either of that users clientorgs will show the total event count for both.
Apologies for the long message, if you have any questions regarding this process please let me know.
Kind regards,
Nathan Goddard
Hello Siim,
I have modified the 'Yellowfin Usage Audit' view to include two additional table which pull in the users linked ClientOrg - Name. This has then allowed me to add filters to existing reports provided in the 'Audit Content' package and therefore the Content > Dashboard reports can be filtered by this field. I have tested this on the 'Top N Reports by Views' (Seen Below)
This filter can then be added to any of the reports within this Dashboard or any new reports you create using this view.
I have attached an export of the view I have modified which also shows the change I have made to this report. I recommend importing this into a development/testing environment first if available. From here you will be able to see the additional tables, joins, conditions and the calculated field required to handle NULL values in the ClientOrgName (as the default client is Null). (Shown Below)
Additional Tables
Calculated Field
ClientOrgName added as Filter
Please note that there are limitations to this, the most important being that if a user is assigned to multiple clientorgs then selecting either of that users clientorgs will show the total event count for both.
Apologies for the long message, if you have any questions regarding this process please let me know.
Kind regards,
Nathan Goddard
Hi Siim,
I just wanted to check in to see if my previous response was any help. Please let me know if you have any questions or queries about this.
Kind regards,
Nathan Goddard
Hi Siim,
I just wanted to check in to see if my previous response was any help. Please let me know if you have any questions or queries about this.
Kind regards,
Nathan Goddard
Hi Siim,
Just checking in to see if my previous response was helpful and if you had any further questions on this matter?
Kind regards,
Nathan Goddard
Hi Siim,
Just checking in to see if my previous response was helpful and if you had any further questions on this matter?
Kind regards,
Nathan Goddard
Hi Siim,
I will now be marking this ticket as completed. If you do have any further questions on this matter please feel free to reach out to us.
Kind regards,
Nathan Goddard
Hi Siim,
I will now be marking this ticket as completed. If you do have any further questions on this matter please feel free to reach out to us.
Kind regards,
Nathan Goddard
Replies have been locked on this page!