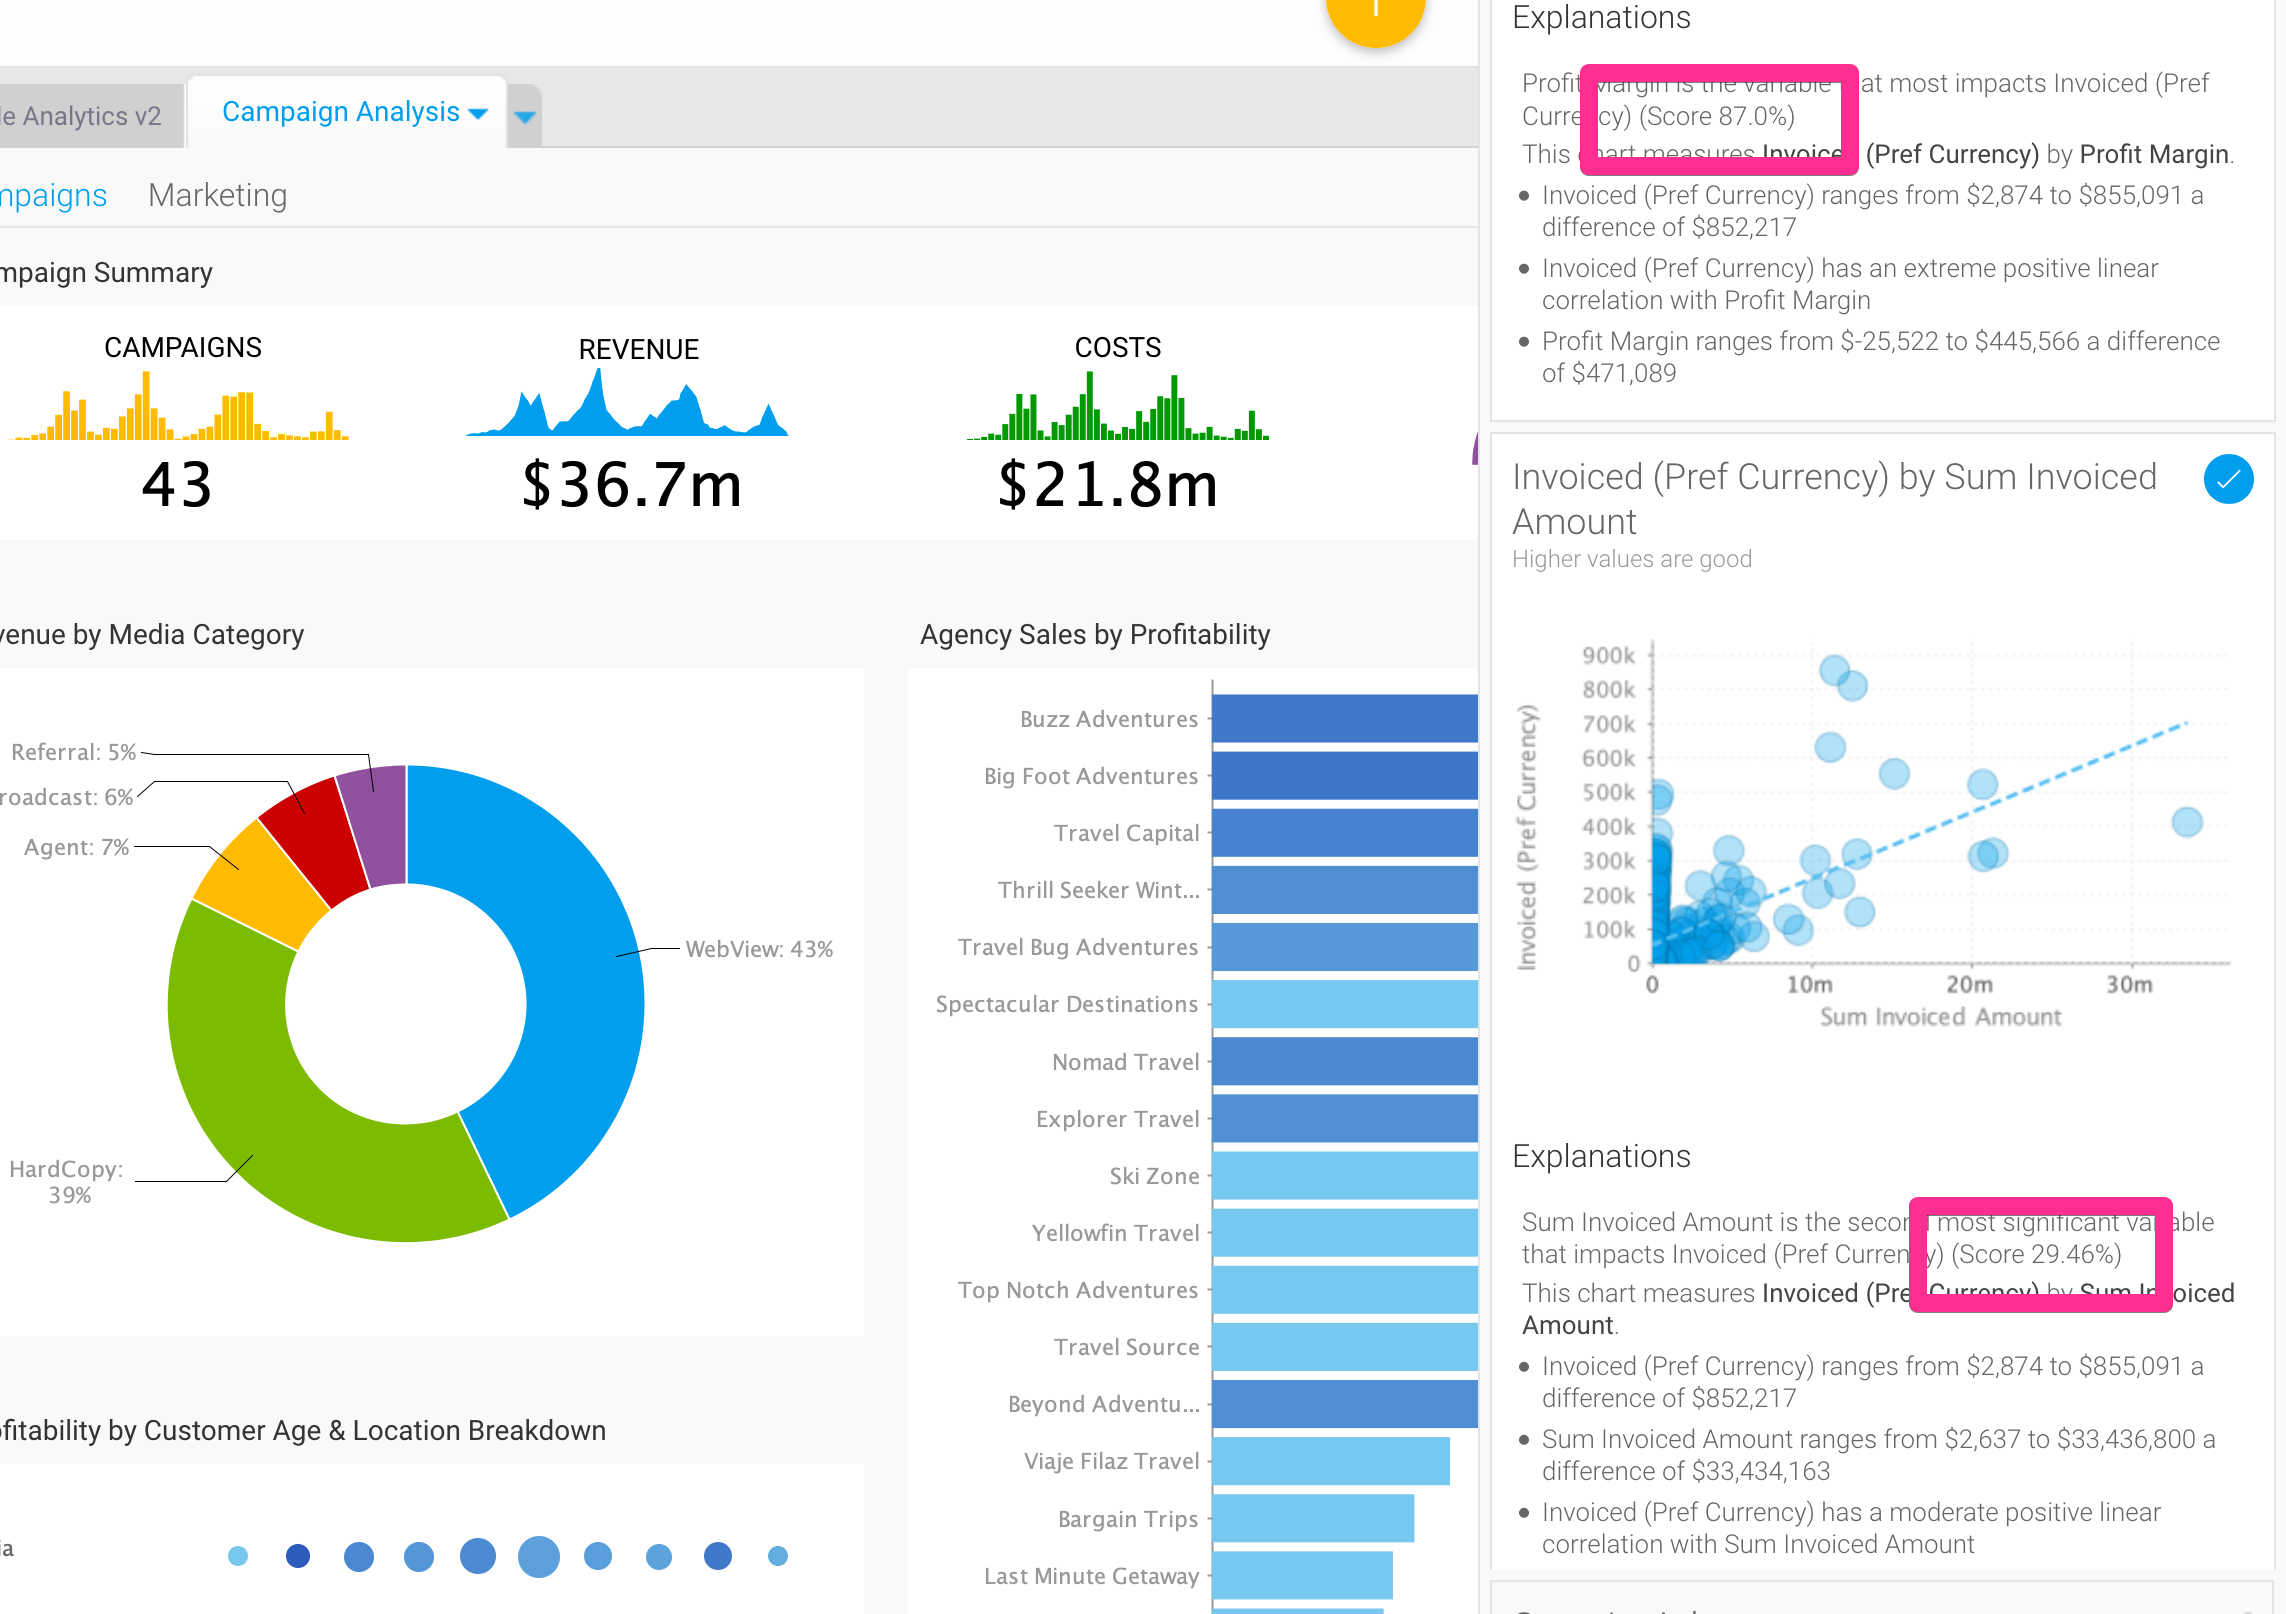
Please tell us about the score displayed in Insight Narrative.
Answered
Hi Team,
How is this score calculated?
How many score should I judge to be high(or low)?
What does this score mean?
Regards,
Yuu.

 The same question
Hi Yuu,
The “score” is the R^2 coefficient that is derived from the linear regression model. It essentially explains how well the model represents the data. More precisely how much of the variation from the mean the model accounts for (87%).
https://blog.minitab.com/blog/adventures-in-statistics-2/regression-analysis-how-do-i-interpret-r-squared-and-assess-the-goodness-of-fit
When training a linear regression model, a common approach is to try and optimize this value. In our case we rank what model you see first based on this value.
As a broad perspective, I tend to see the linear regression charts as far less useful than the variance charts (that we have added far more of in recent builds). If there is a strong correlation between two variables, this will most likely persist regardless of what individual event you are looking at. In the example you linked it is saying that the our linear regression model for the relationship between invoiced amount and profit margin is strong. This will always be true, profit is always strongly correlated with how much you are invoicing 😊
Hopefully this explains this a little more.
Regards,
Paul
Hi Paul,
Thank you for your advice!
OK, I study R-squared ;)
Regards,
Yuu.
Hi Paul,
Thank you for your advice!
OK, I study R-squared ;)
Regards,
Yuu.
Hi Yuu,
No problems and thanks for getting back to me.
Cheers,
Paul
Hi Yuu,
No problems and thanks for getting back to me.
Cheers,
Paul
Replies have been locked on this page!