Makeover Monday - Week 5 - What the Most Profitable Companies Make per Second
Overview:
Our consulting teams across the regions are participating in a popular social data project called Makeover Monday. The way this project works: a new data set is released every week - usually accompanied by a chart - and participants have the chance to improve the chart/story, tell a new one, or simply create an awesome dataviz with Yellowfin.
You'll start to see some of these posts within the Community highlighting our submissions for this project. If you have any questions around the submissions e.g about data preparation, data viz creation, to canvas design - please feel free to comment below. If we get enough common questions around a submission, we might even spin up a blog or video to help!
Week 5
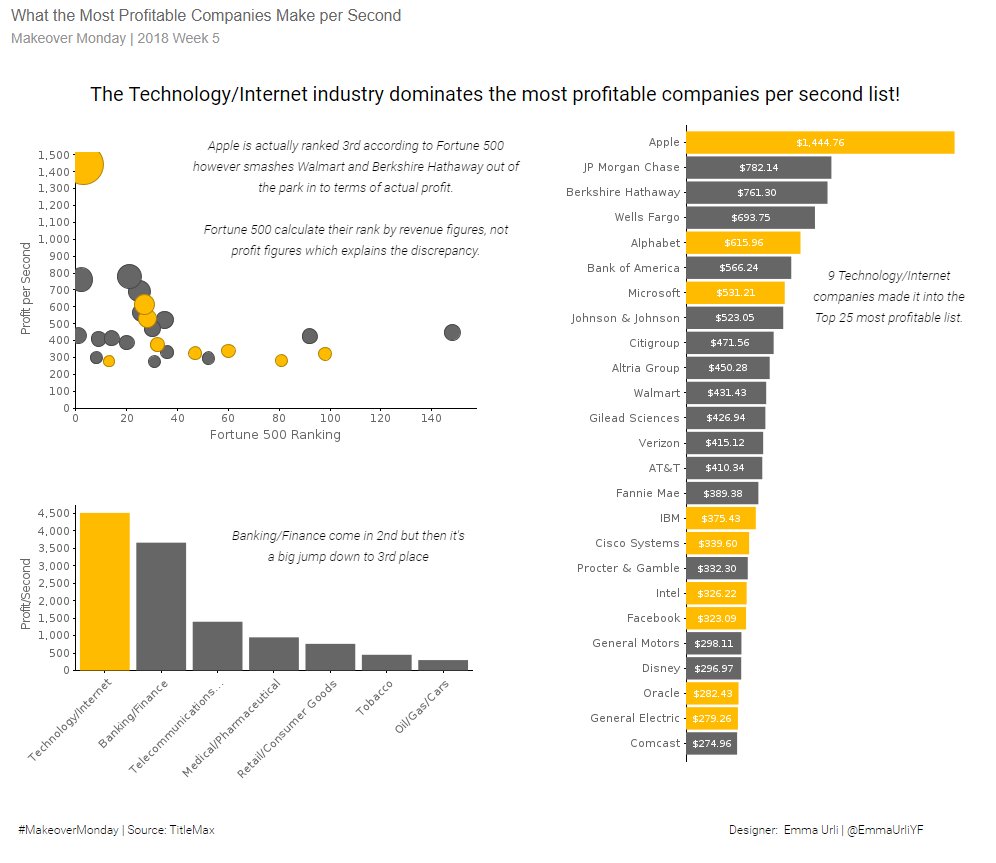
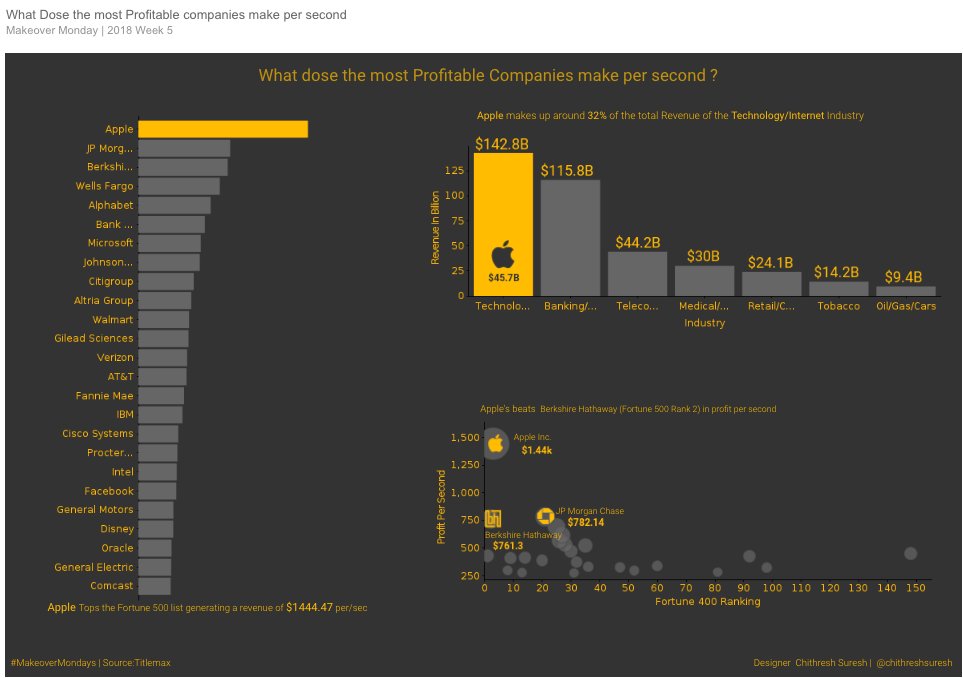
This week's submission is on a dataset that shows "What the Most Profitable Companies Make per Second". We have two entries this week by Emma and Chitresh:
 Interactive version: https://discover.yellowfinbi.com/RunReport.i4?reportUUID=7193af0b-0d88-408c-86f8-7ab4746a96fe&primaryOrg=1&clientOrg=1

Interactive version: https://discover.yellowfinbi.com/RunReport.i4?reportUUID=4092f432-552f-4b6a-a96d-fe5e64db0a53&primaryOrg=1&clientOrg=1
Data set available at: http://www.makeovermonday.co.uk/data/

 The same question
Some pretty charts right there! ..but when I look at these stats, then I look at my bank account, I get depressed.
Some pretty charts right there! ..but when I look at these stats, then I look at my bank account, I get depressed.
Agreed, some really good examples of how to make data insights jump off the page.
Agreed, some really good examples of how to make data insights jump off the page.
Replies have been locked on this page!