How to wrap text in column chart
Answered
Hi Team,
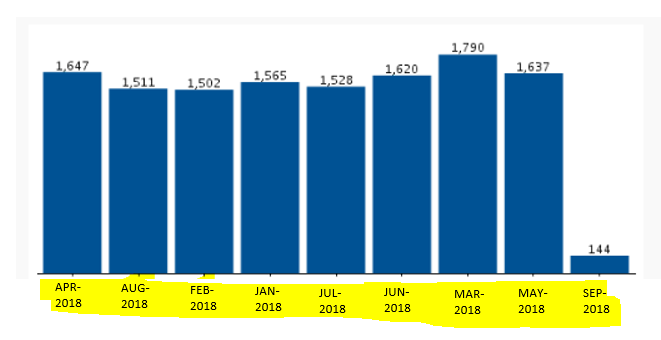
I have created chart, in that i want to wrap text in my horizontal values (refer expectation screenshot and highlighted in yellow). I have attached here with current one and expect one. Could you please check and advice.
Thanks
Kalaiselvan
 The same question
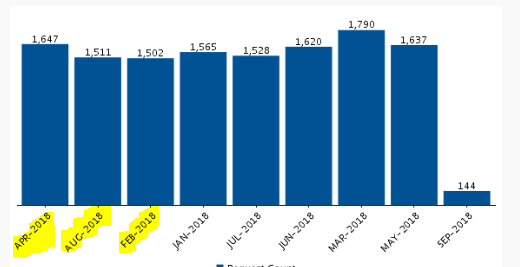
Hi Kalaiselvan,
your charting expectation may be achieved if you use the Yellowfin feature called Javascript Charts. There are lots of articles on the internet about how to do wraparound for the horizontal axis label in Javascript Charts, for example, I did a quick search and found the following:
https://canvasjs.com/docs/charts/chart-options/axisx/labelwrap/
However, if you are specifically talking about Yellowfin's current functionality for its native charts, then no, it is is not currently possible to do a wraparound for Horizontal Axis Labels. Please feel free to raise an Idea in the Yellowfin Community if ye so desire.
regards,
David
Hi David,
Thanks for your response. To use Javascript Charts will not be feasible for an end user point of view, that is more in to technical aspect.
I except to be this as an option in chart settings to easily accessible by all the user. ie by enable/disable this option in the charts.
As you suggested i will log this as an idea to be available in future.
Thanks
Kalaiselvan
OK Kalaiselvan, yes I understand your point.
regards,
David
OK Kalaiselvan, yes I understand your point.
regards,
David
Replies have been locked on this page!