How to nightlight any point on Line chart
Answered
Hi,
We are using some machine output values to represent on a chart, on X-axis we have different samples, there is one more field in the report having test cases on these samples, now the problem is we need to highlight Logged Defects in test cases if any.
Attached Image for reference.
Regards
Pratap
Files:
Defact.JPG
 The same question
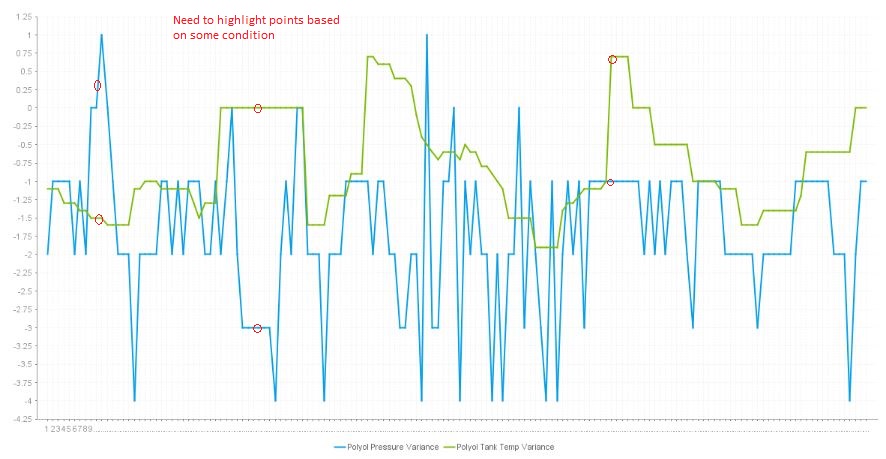
Hi Pratap,
Thanks for your email.
I believe this is not possible at the moment. I will also discuss with other team members.
If you are looking for this feature, we may convert this ticket into idea ticket.
Please let me know how often you will use this feature and the use case.
Also let me know if you have any questions.
Regards,
Mahesh
Hi Mahe Thatipamula,
Thanks for the response, This is a general requirement in my case, it will be better to consider this an idea.
Can you suggest any way out to even represent these Defects on Chart with Lines for now so that user can understand that there is any defect logged in this place?
Regards
Pratap
Hi Pratap,
Thanks for your reply.
I am not sure what data do you have in for the defects.
Try adding that column onto chart so that defects are displayed on the chart for the moment.
Let me know if you have any more questions or if you have any difficulty.
Regards,
Mahesh
Hi Pratap,
Thanks for your reply.
I am not sure what data do you have in for the defects.
Try adding that column onto chart so that defects are displayed on the chart for the moment.
Let me know if you have any more questions or if you have any difficulty.
Regards,
Mahesh
Hi Pratap,
Hope you are doing well.
I am not sure how did it all went with this request.
Can you please let me know if you have any questions?
Regards,
Mahesh
Hi Pratap,
Hope you are doing well.
I am not sure how did it all went with this request.
Can you please let me know if you have any questions?
Regards,
Mahesh
Hi Pratap,
Hope you are doing well.
I am marking this ticket as completed for the moment.
If you have any questions, please reply back.
Regards
Mahesh
Hi Pratap,
Hope you are doing well.
I am marking this ticket as completed for the moment.
If you have any questions, please reply back.
Regards
Mahesh
Replies have been locked on this page!