Conditional Formatting with Filter Values
Answered
I need a way to Conditional format a chart (hide/show) based on the number of filter values selected. I cannot bring the filter value in as a field, because it messes up the chart (showing top 10). Is there a way to ONLY show a filter value (with parameter replacement) when only one to three values are selected?

 The same question
Hi Zack,
Thanks for reaching out. There currently isn't a way to hide/show a Chart based on filter conditions. What I can do is change this to an Idea item and submit an internal enhancement request for this, if you'd like. But first, please provide further details on why this would be desired behavior so I can pass this along with the request to the dev team.
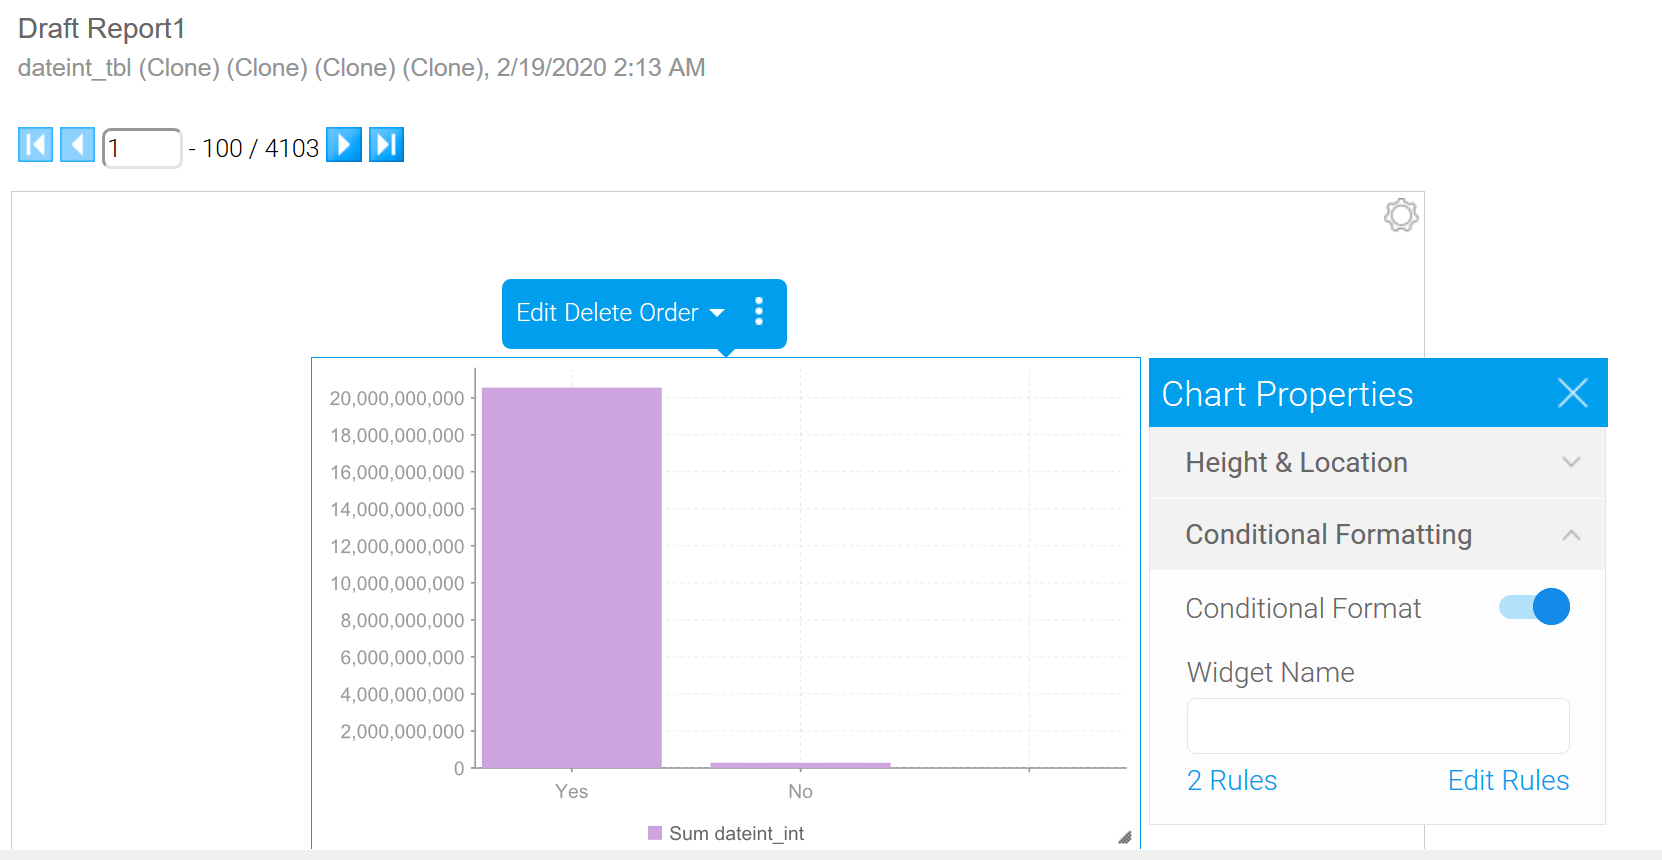
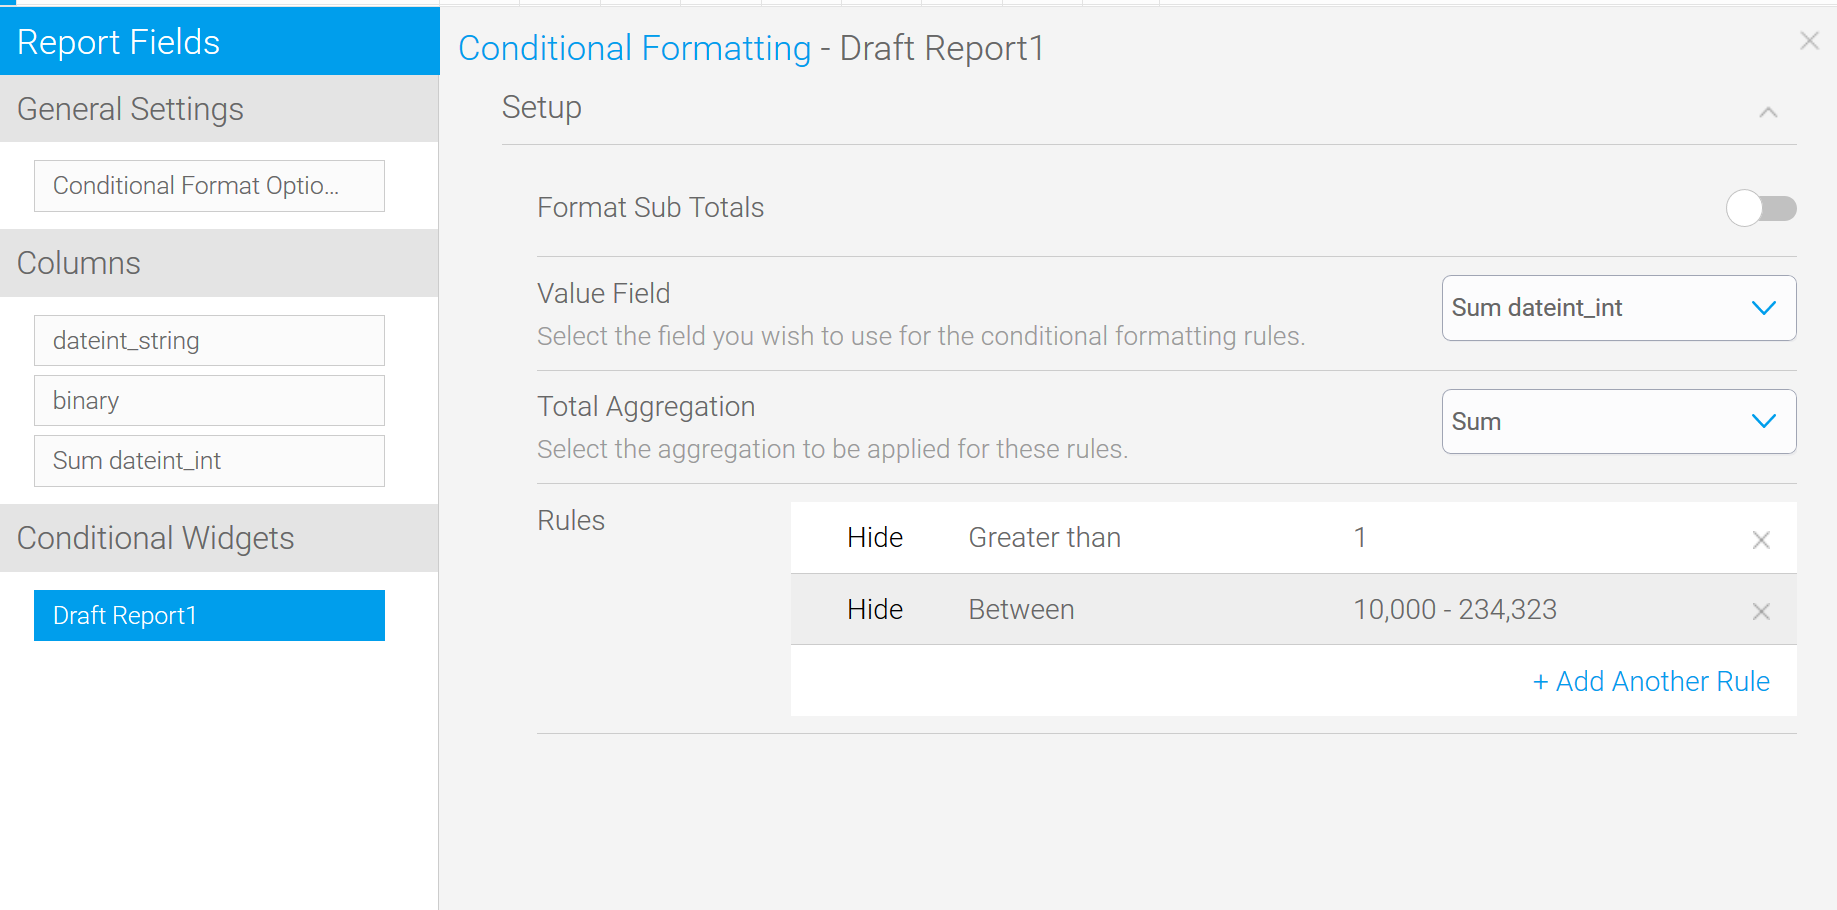
Also, in terms of a possible alternatives, perhaps Visible Series Selection would be suitable for your use case? This won't allow you to fully hide a chart, but you can select (by checking them off) which series are displayed on a chart. Also, if you create a multi-chart canvas by clicking the "+" button towards the bottom right of the charts section, then head back into the Design section and slide in your pre-existing chart to the newly available multi-chart canvas, if you click on the new Chart Widget, there's an option to Conditional Format the widget. You can set conditions here in which the chart will be hidden altogether:

Your idea sounds a bit different but please check into this functionality first and let me know if this possibly gives you what you need here.
Regards,
Mike
Hi Zack,
Thanks for reaching out. There currently isn't a way to hide/show a Chart based on filter conditions. What I can do is change this to an Idea item and submit an internal enhancement request for this, if you'd like. But first, please provide further details on why this would be desired behavior so I can pass this along with the request to the dev team.
Also, in terms of a possible alternatives, perhaps Visible Series Selection would be suitable for your use case? This won't allow you to fully hide a chart, but you can select (by checking them off) which series are displayed on a chart. Also, if you create a multi-chart canvas by clicking the "+" button towards the bottom right of the charts section, then head back into the Design section and slide in your pre-existing chart to the newly available multi-chart canvas, if you click on the new Chart Widget, there's an option to Conditional Format the widget. You can set conditions here in which the chart will be hidden altogether:

Your idea sounds a bit different but please check into this functionality first and let me know if this possibly gives you what you need here.
Regards,
Mike
Hi Zack,
I just wanted to check in and see how things are going with this.
Regards,
Mike
Hi Zack,
I just wanted to check in and see how things are going with this.
Regards,
Mike
I am still exploring this... I still am looking for a way to show certain text or information based on the specific filter choice. Also, I am looking to show specific text/information based on the quantity of the filters chosen (as in, if the user chooses ALL, show "All selected", if qty is more than ##, then "Too Many items Selected to list"... and subsequently, if qty < ##, display values.
I am still exploring this... I still am looking for a way to show certain text or information based on the specific filter choice. Also, I am looking to show specific text/information based on the quantity of the filters chosen (as in, if the user chooses ALL, show "All selected", if qty is more than ##, then "Too Many items Selected to list"... and subsequently, if qty < ##, display values.
Hi Zack,
Thanks for your response. I think this aspect:
"I am looking to show specific text/information based on the quantity of the filters chosen (as in, if the user chooses ALL, show "All selected", if qty is more than ##, then "Too Many items Selected to list"... and subsequently, if qty < ##, display values."
Would also be another Idea.
Please look at the options from my initial reply and let me know how goes when you get the chance, then if still desired, please respond regarding the Idea itself, so I can convert this to an Idea and submit an enhancement request.
Then, in terms of this new Idea, if you could please submit a separate Idea ticket, along with a more detailed business case usage similar to what's requested for original idea, so we can keep the Ideas separate and subsequently scope that out further and pass along for consideration for potential future development, that'd be great.
Regards,
Mike
Hi Zack,
I just wanted to check in and see if you could provide the additional requested feedback on this. This would very helpful in increasing the chances of this being developed and implemented.
Thanks,
Mike
Hi Zack,
I just wanted to check in and see if you could provide the additional requested feedback on this. This would very helpful in increasing the chances of this being developed and implemented.
Thanks,
Mike
I just submitted a ticket.
https://community.yellowfinbi.com/topic/more-conditional-formatting-on-charts-reports-and-dashboards-based-on-filter-choice
Thanks again for your help!!
I just submitted a ticket.
https://community.yellowfinbi.com/topic/more-conditional-formatting-on-charts-reports-and-dashboards-based-on-filter-choice
Thanks again for your help!!
Hi Zack,
Great, thanks! I'll reply in that ticket and close this one out. Please don't hesitate to reach out with any other additional questions or concerns as well.
Regards,
Mike
Hi Zack,
Great, thanks! I'll reply in that ticket and close this one out. Please don't hesitate to reach out with any other additional questions or concerns as well.
Regards,
Mike
Replies have been locked on this page!