


Threshold / Ref Line value for Charts should be Dynamic
Hi Team,
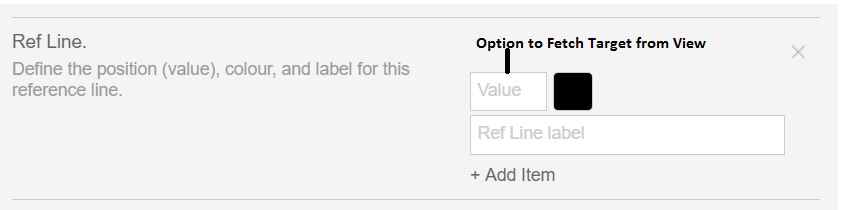
Ref Line or Threshold for Charts is great feature it gives quick attention on problematic data points. But we would love to use this feature in a Dynamic manner,
If we able to use this value from View then it will make much more sense when we use it in much complex scenario,
Use Case :
We have a Report which gives us an UpTime and DownTime analysis of all Business Services in Stacked Bar Chart grouped by month and we have included Business Service in a Section, Now we can set Uptime threshold as 95% as Global Target but it may not be applicable for all the business services as some of critical business service's threshold may be calculated based on business logic,
So instead of hard coding it as 95% if we can use the field from View which has a specific target value for each business Services then it will provide Accurate analysis,
Thanks,
Abhijeet
 I like this idea
Hi Abhijeet,
Thanks for your post.
We are looking into this and will update you.
Regards,
Mahe
Hi Abhijeet,
Thanks for your post.
We are looking into this and will update you.
Regards,
Mahe
Hi Abhijeet,
This is something that has been logged as an enhancement request to be discussed for a future release.
In the meantime, you can think about using a conditional format applied to the metric column and then display the conditional format on the chart instead.
Thanks,
David
Hi Abhijeet,
This is something that has been logged as an enhancement request to be discussed for a future release.
In the meantime, you can think about using a conditional format applied to the metric column and then display the conditional format on the chart instead.
Thanks,
David
To provide a little more insight on how you can implement via the conditional formats.
1. Create your condition.
2. On you chart settings, modify the series settings and enable the conditional format.
You end up with something like this:
To provide a little more insight on how you can implement via the conditional formats.
1. Create your condition.
2. On you chart settings, modify the series settings and enable the conditional format.
You end up with something like this:
Hi guys, I also would like to have a dynamic reference line.
As we know, currently these reference lines are static, hard coded. We need to give the exact values for it.
However, it would be great to have a dynamic reference line whose value change according to a specific data point.
For example, in my dataset, I have average values as another data point where I would like to use as a reference line. So, instead of having a static reference line, I would like to have my average values as a reference.
What I want is slightly different than the original idea (which requests reference line to be pointed to a column in a view as far as I see) but the general concept is same. Dynamic reference line.
Replies have been locked on this page!