
Category
Report Builder
Product Version
7.3
How I can add values on combination chart? here example screenshot,
Answered
Dear Team,
I got request from our potential customer to make report using their data.
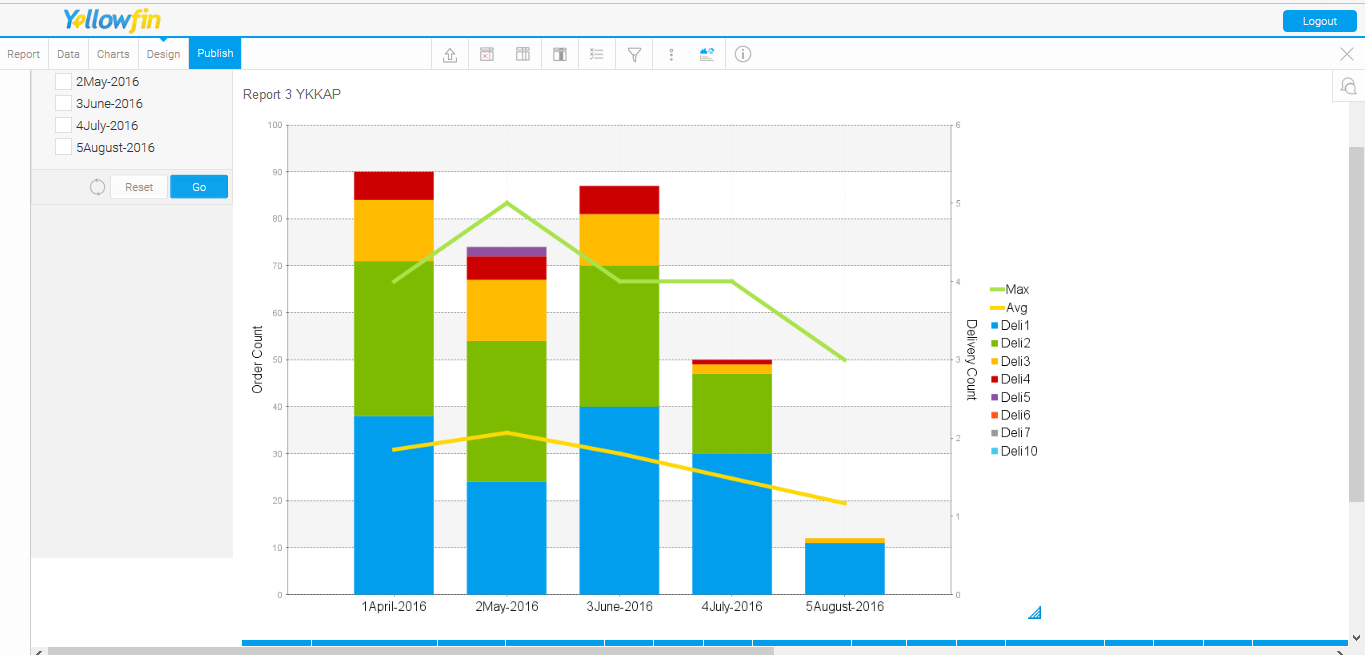
I Have create graph using combination chart, but I can not find how to show values on the chart like the sample graph our customer gave.
Please see my atachment.
Best Regards,
 The same question
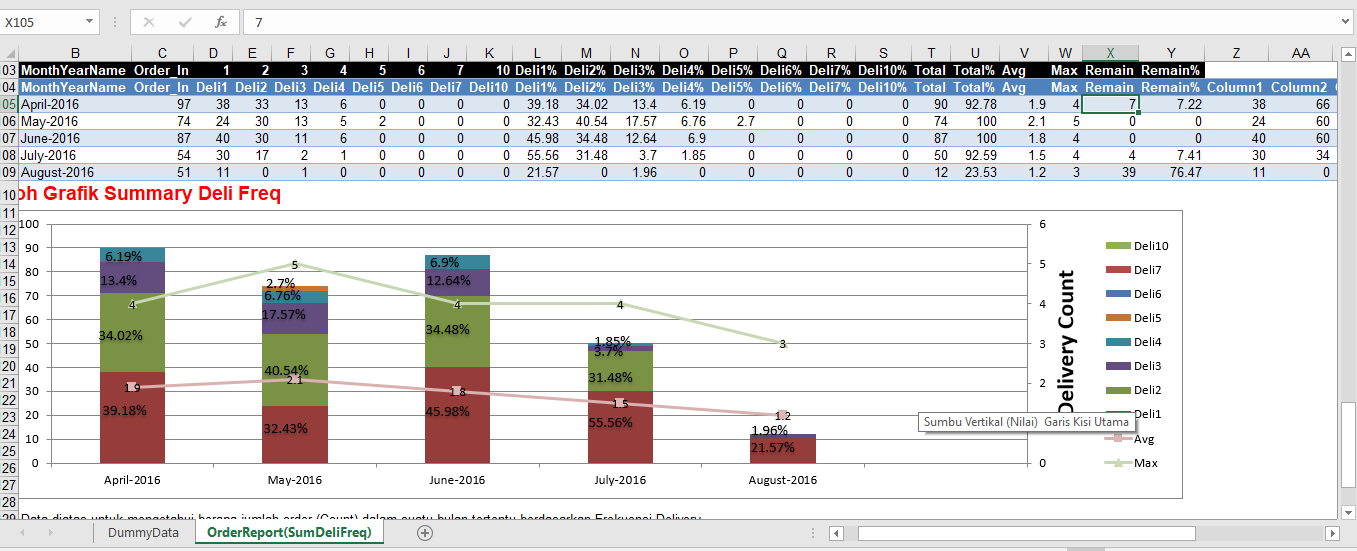
Hi Endo,
Unfortunately this is not possible in the overlay chart. I would recommend either using JavaScript charts to create your own chart, or to raise this as an idea for the product team to review. (Let me know if you would like me to convert this into an idea)
Sorry for the inconvenience!
Regards,
Nathan
Hi Nathan,
Thank you for your reply,
It would be great if it is raise as an idea for product team,
Anyway, could you please give me sample of using JavaScript charts?
Regards
Endo
On 11/1/2017 1:39 AM, Yellowfin Support wrote:
Hi Nathan,
Thank you for your reply,
It would be great if it is raise as an idea for product team,
Anyway, could you please give me sample of using JavaScript charts?
Regards
Endo
On 11/1/2017 1:39 AM, Yellowfin Support wrote:
Hi Endo,
I have created the following idea from this:
https://community.yellowfinbi.com/topic/allow-data-labels-on-combination-charts
These two articles should help you get started with JavaScript charts:
https://community.yellowfinbi.com/knowledge-base/article/javascript-charting-libraries-ski-team-examples
https://community.yellowfinbi.com/knowledge-base/article/tips-to-code-and-debug-a-javascript-chart-in-yellowfin
I am going to close this ticket for now. Any updates to the idea will be posted there. Let me know if you have any questions on the JavaScript charts.
Regards,
Nathan
Replies have been locked on this page!