
Yellowfin Support Team
Category
Chart Builder
Product Version
8.0
Stacked column chart for moving average data
Answered
Hi Team,
I am trying to chart a stacked column type for variables with 4-month moving average advanced function applied (please see attached file and plugin I use). I play around with the setting of horizontal axis (i.e. month) and the filter to get rid of the first 3 month data (which are empty because of moving average calculation), but not succeeded.
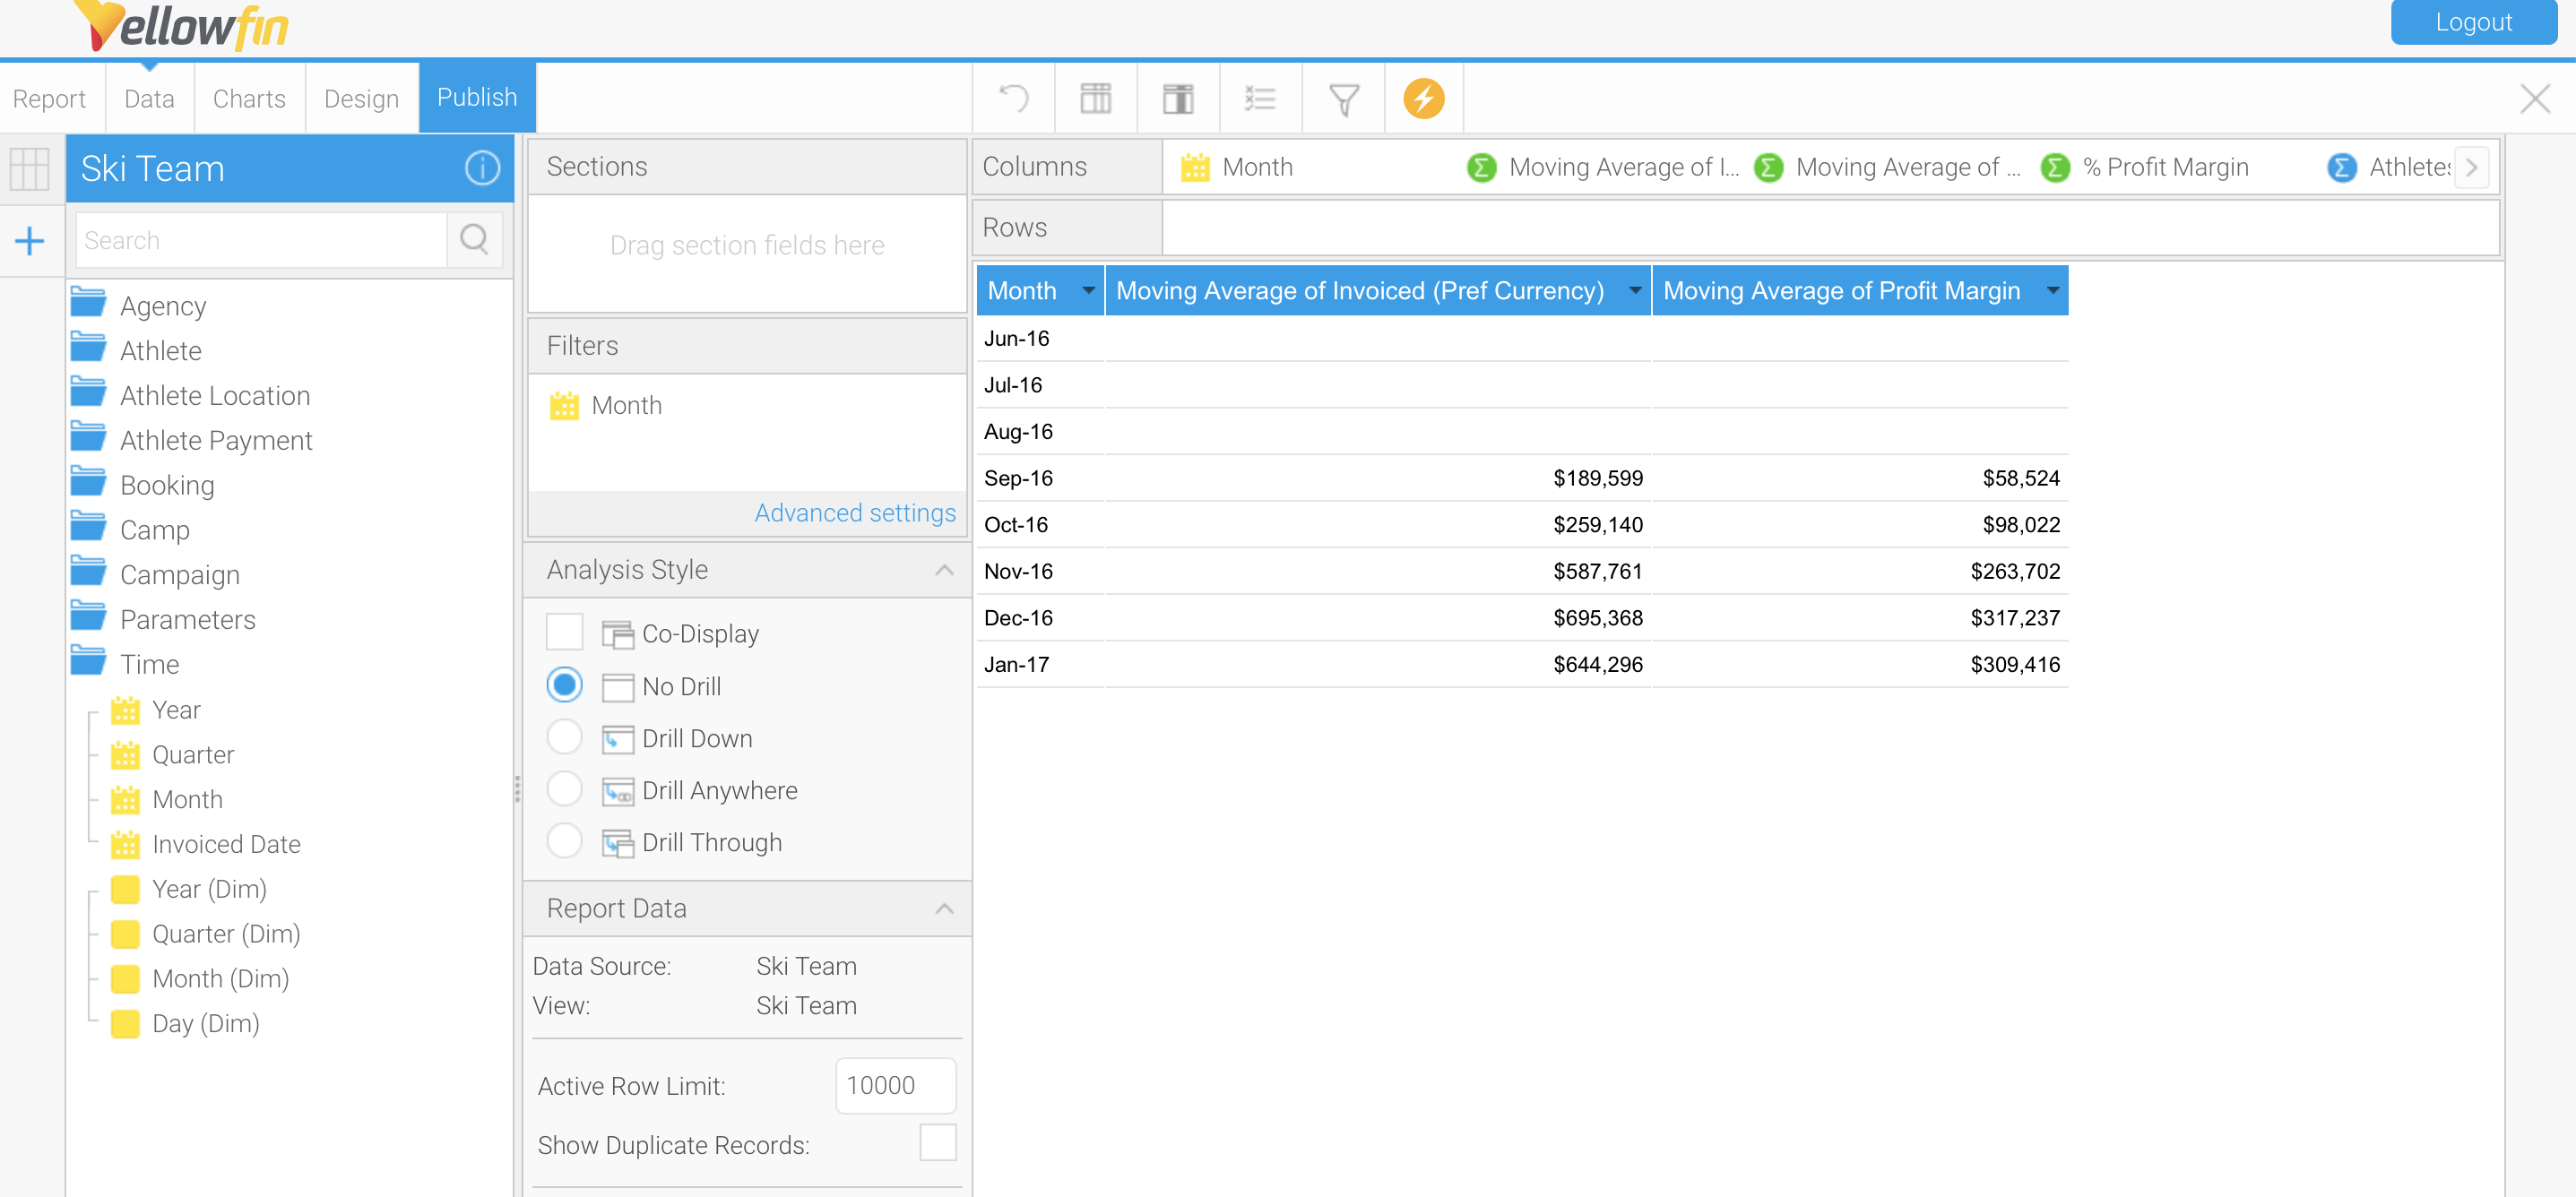
I also attached the structure data I currently use.
Is there a way to show the chart without the first 3 months?
Thanks!
Anggono
Notes: YF build: 20181113
 The same question
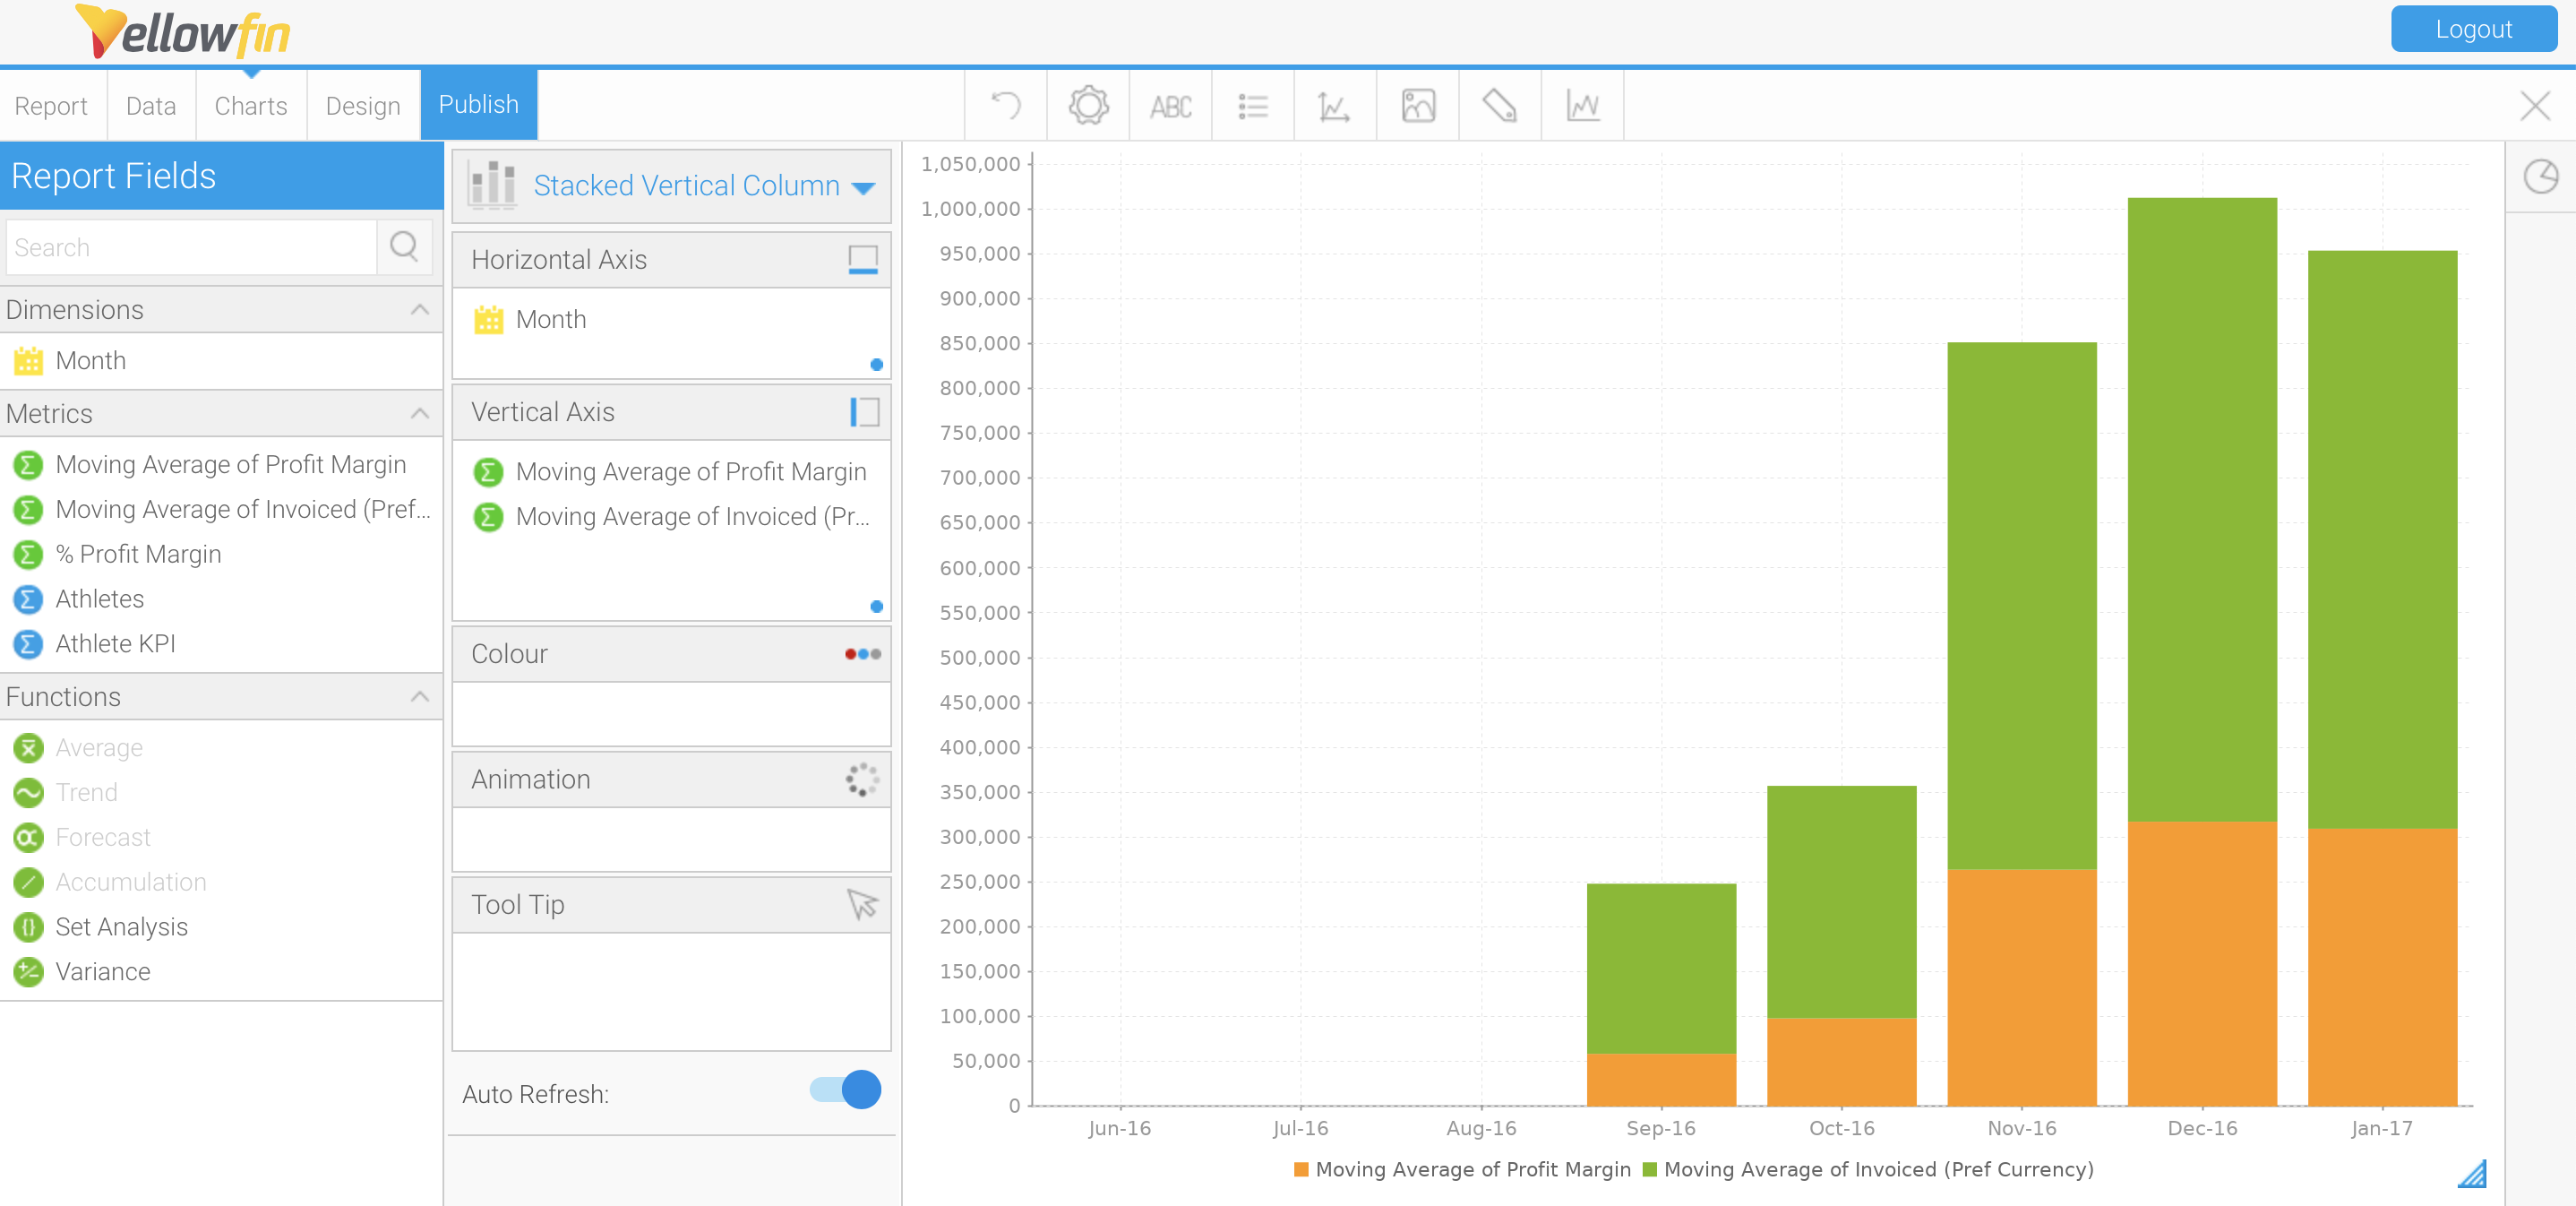
Hi Anggono,
Thanks for reaching out. I was seeing this too using, ironically, "Moving Average (Corrected)":
No matter what I did with the filtering the first three values were blank.
If I use the standard "Moving Average" though, it seems to work:
Which one are you attempting to use? If not the regular Moving Average, please try with that one and let me know if you're still seeing this issue.
Thanks,
Mike
Hi Anggono,
I just wanted to check in and see how things are going with this.
Regards,
Mike
Hi Anggono,
I just wanted to check in and see how things are going with this.
Regards,
Mike
Replies have been locked on this page!