JavaScript Charts Loading Issue
Hi everyone,
Could you guys help me with a issue that I'm trying to resolve without success?
I've created a JavaScript Chart, using one of the
charts provided by google . The specific chart created was an simple BarChart.
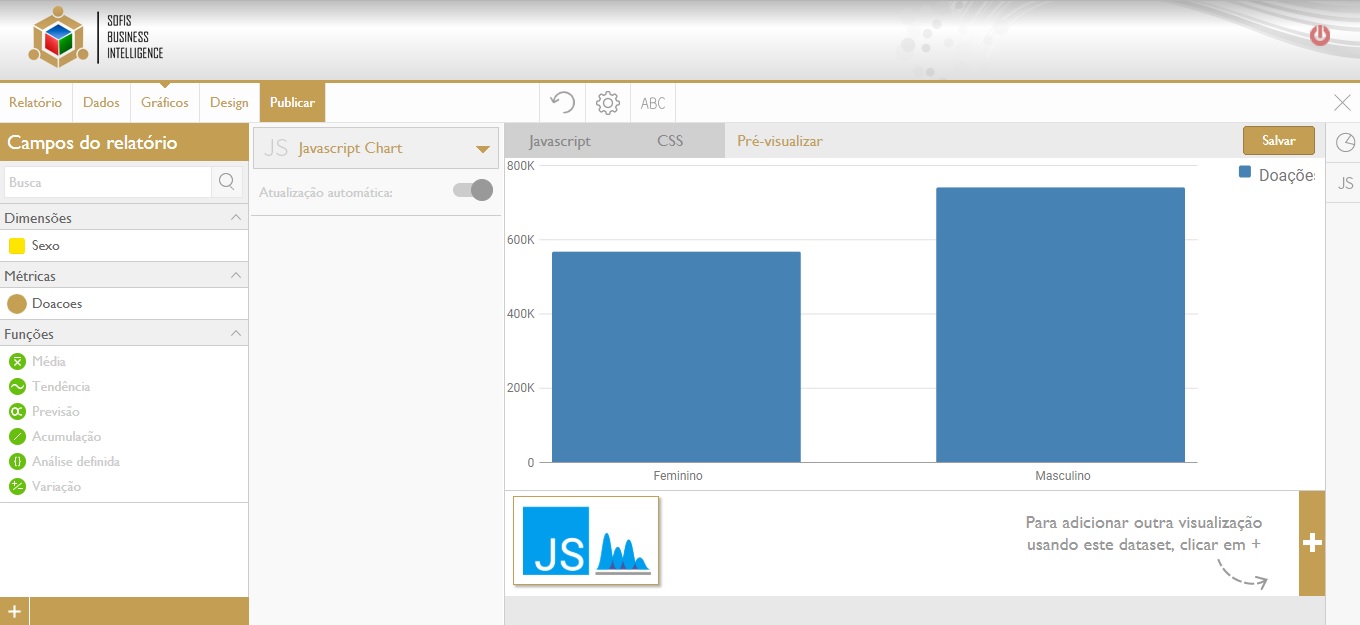
The problem, is that when I'm on creation window, if I jump to preview tab, the chart says that theres something wrong and doesn't load correctly, but if I just return to javascript chart and go back to preview, it loads without any problem.
If I just ignore this and go directly to design tab so I can see how it would be when I save this JavaScript chart, it doesn't load. But it load's if I switch on/off the source table of the created chart. It seems that this is some kind of refresh issue, but I've read the code too many times and I didn't found anything. Maybe it's just a coincidence, but this issue just happens when I use google charts library. It doesn't happen when I'm using github charts.
Can someone help me?
I've attached the code so you guys can see if there's anything I did wrong. There's also two prints showing the chart with error and the chart without error.
 The same question
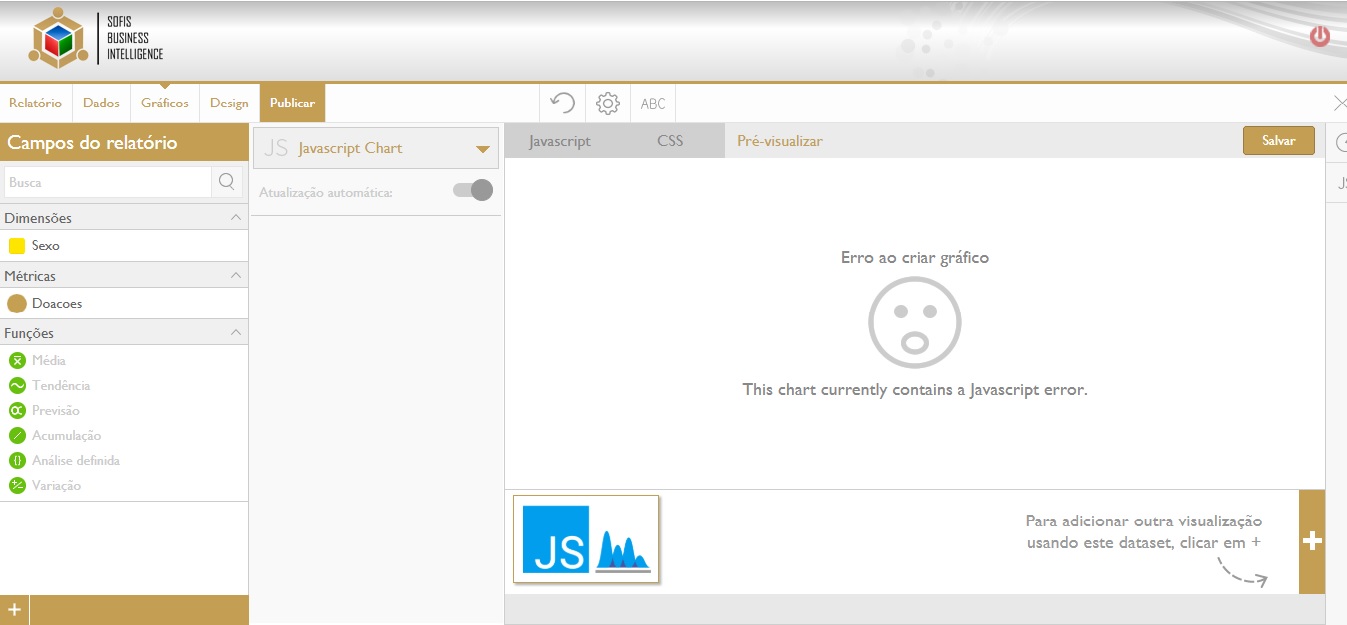
Hi Renato,
Thanks for getting in touch. Custom Javascript Charts are generally seen as more of a technical consultant level of support, but I will see what we can do for you.
So firstly can I get you to try using the google JS chart located here to see if you are getting the same problem please so we might be able to determine if it's the actual code you are using or something else.
Thank you,
Paul
Hi Renato,
Please leave this with me as I will need to seek further assistance with this and will get back to you asap.
Regards,
Paul
Hi Renato,
Please leave this with me as I will need to seek further assistance with this and will get back to you asap.
Regards,
Paul
Replies have been locked on this page!