
Regionalization Part Two
Hello Nathan - our monetary data is not stored converted into a single currency. For customer x the currency of the numbers might be USD, while another customer it may be CAD, yet a third might be GBP. Our reporting uses a significant number of reports publicly on the dashboard, so it isn't realistic to have a different report per currency.
As we discussed on the phone today, we are doing some creative work using the DASH-XML product and some custom work returning the currency for the data in order to use the same YF report and dash-XML dashboard to show one currency symbol for customer A and another currency. The problem I haven't figured a way around yet, is when the currency symbol is defined (Hard coded) as a prefix for the amount, and now we want that prefix to be dynamically set based on an attribute of the the data set. The currency symbol shows up on mouseovers/popups on line charts, pie charts, etc. Our ideal would be to figure out how to dynamically indicate/change the currency based on the customer that is viewing the data. Possibly even the mouseover could have another attribute that says "Currency: USD ($)" See the attached screen shot for a good look at what I would like to figure out how to accomplish.
 The same question
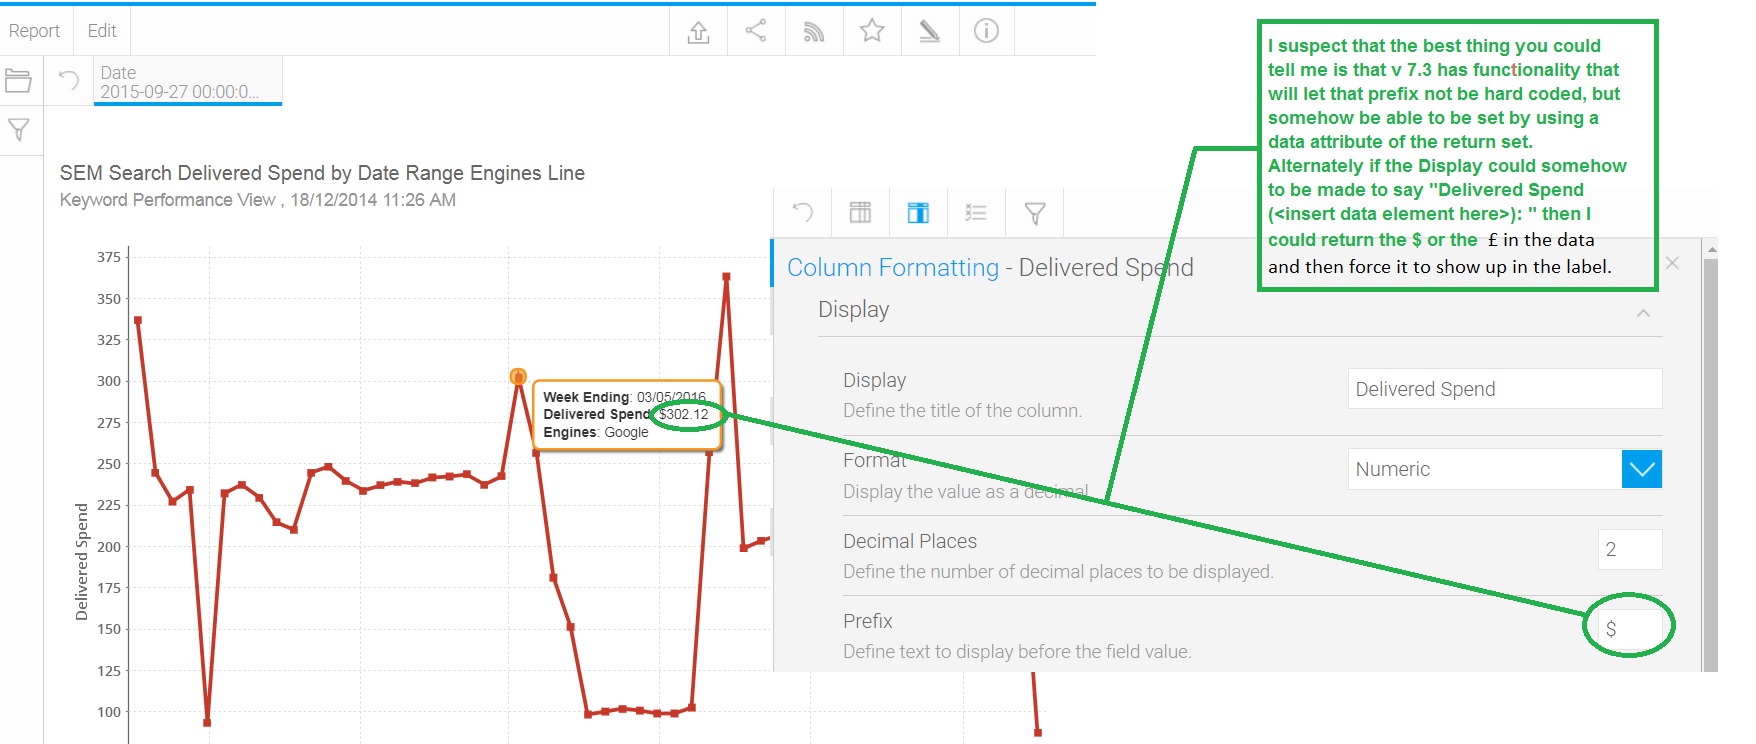
Additional need/Ask. I have reports that have monetary amounts as the x axis scale. They are currently formatted with a prefix ($). To internationalize, I need to find a way for the prefix not be static, but dynamically defined (formulaic or controlled within the data).
Additional need/Ask. I have reports that have monetary amounts as the x axis scale. They are currently formatted with a prefix ($). To internationalize, I need to find a way for the prefix not be static, but dynamically defined (formulaic or controlled within the data).
Hi Bill,
Thanks for the elaboration and sorry for the delay here. I have been playing with various approaches here but unfortunately have had to rule all of them out for one reason or another. Either way, I should have a more substantive response for you later today or early tomorrow.
Regards,
Nathan
Hi Bill,
As I mentioned, my hopes of an easy way to solve this have waned:
We are currently expanding the tool-tip functionality. In 7.3+ we introduced a tool-tip option for scatter charts (see attached screenshot). This will replace the available tool-tip with anything of your choosing. This could be the result of the advanced function mentioned above and would meet your needs well. Unfortunately this only applies to scatter charts at the moment, and I am not sure the time-line on development for other types. What chart types are you looking to build in these reports?
To have a solution that is truly sustainable and not just a one-time hack, we will need to raise enhancements. Either:
In 7.4 we will be introducing a light ETL framework, that allows you to conduct transformations on data prior to the view editor. Among other things, this will introduce a new interface for clients to code their own transformation functions. I will be receiving the foundation of this within the next couple of days and should be able to tell you then if this is an approach worth looking into.
Regarding dynamic axis labeling: This is going to be far more difficult. Are you referring to the tick labels, or the axis title?
Let me know your thoughts here.
Regards,
Nathan
Hi Bill,
One other thought:
Can you pass along a sample of one of these dash-xmls?
Nathan
Hi Bill,
One other thought:
Can you pass along a sample of one of these dash-xmls?
Nathan
Examples attached...
Examples attached...
Hi Bill,
I have been looking for other ways to approach this, but it seems the tool-tip option will be the best here. After looking a bit deeper into the dev planned for 7.4, I am seeing hints of a complete tool-tip rework that will dramatically expand the possibilities for all charts. Of course it is too early to provide any guarantees here, but this looks quite promising and I will keep you updated on this.
Regarding the advanced function. I can provide you with a sample that converts a number into a formatted string based on another columns value, if it would help get started?
Generally, does this sound like an approach that will work for your needs?
Regards,
Nathan
Hi Bill,
I have been looking for other ways to approach this, but it seems the tool-tip option will be the best here. After looking a bit deeper into the dev planned for 7.4, I am seeing hints of a complete tool-tip rework that will dramatically expand the possibilities for all charts. Of course it is too early to provide any guarantees here, but this looks quite promising and I will keep you updated on this.
Regarding the advanced function. I can provide you with a sample that converts a number into a formatted string based on another columns value, if it would help get started?
Generally, does this sound like an approach that will work for your needs?
Regards,
Nathan
Replies have been locked on this page!