Line chart - wrong number format in quick info

Stefan Hall shared this problem 14 months ago
Defect Logged

Hi,

the calculation of marked values in the quick info is a great function.

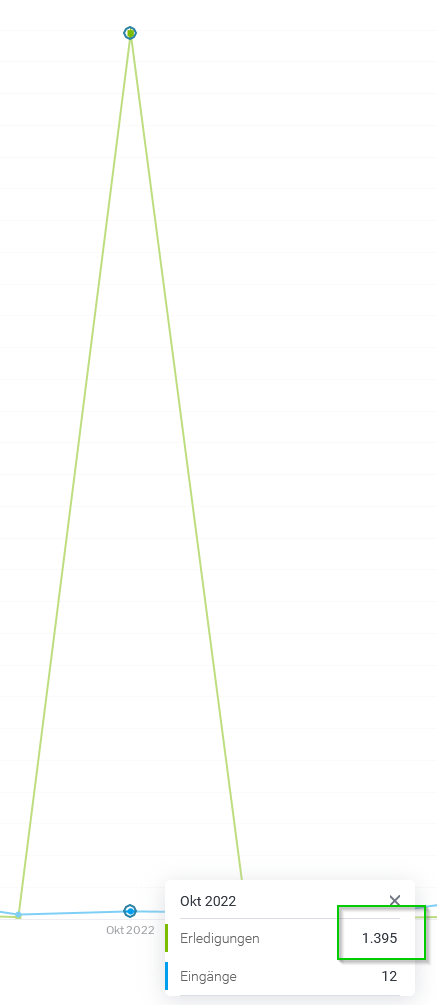
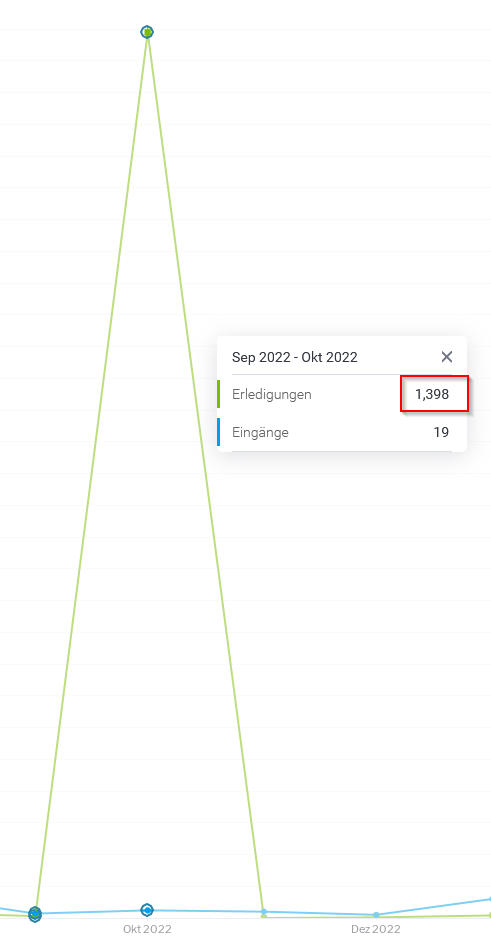
Unfortunately, the configured format is not taken into account when preparing the numbers. In Germany, a dot separates the thousands and a comma the fraction > 1.

As it is correct, you see in the quick info for one entry, as soon as more are marked, the comma appears again in the wrong place.

Please correct the error
;) Stefan (v9.8.0.1)


b2de45a571a0c0ba3a4d861a6a5591828a04d30519bfd9d6f057c5fd197384d8

Replies (3)

photo
1

Hello Stefan,

Thank you for contacting yellowfin support.

Could you please provide the following information to investigate further:

1. May I know which yellowfin version you are currently using.

2. Could you please provide the replication steps to test this issue in my environment.

Thanks,

Regards,

Priya Chegudi.

photo
1

Hi Priya,

I thought I had already done that. OK, I'll start again ;)

1. you can find the version behind my name => v9.8.0.1.

2. set the text formats for numbers

7899efe96b5d56e02962eb1f58093515

3. create a report with more than 1000 entries for a point on the timeline

4. create a line chart so that more than 1,000 entries are counted for one point

5. look at the tooltip for this entry => you see a dot/point as thousand separator (OK, as configured)

6. mark a period at line chart, so that several points are added up

=> you see a comma instead of a dot/point as thousand separator => DEFECT

;) Stefan

photo
photo
1

Hello Stefan,

I hope you are doing well.

I appreciate you giving this information. I'll check this out on my end and get back to you as soon as I can with my findings.

Please revert back if you have any further queries happy to assist you.

Good day!

Regards,

Priya Chegudi.

photo
1

Hello Stefan,

I hope you are doing well.

I have replicated this issue as per your steps but the stated functionality was working fine for me. I'm providing a screen recording of my replication here. Please revert back if I'm lacking any details in reproducing this issue.

Let me know your thoughts on this.

Regards,

Priya Chegdui.

photo
1

Hi Priya,

in the end, you only looked at the individual values. Mark several years with the mouse, then the single values are added in the quick-info and this sum is formatted incorrectly.

;) Stefan

photo
1

Hello Stefan,

A screen video of this issue would be greatly appreciated. Unfortunately, in accordance with your prior response, we are lacking the procedure to reproduce this issue.

Regards,

Priya Chegudi.

photo
1

Hi Priya,

no problem, I have attached the short video

;) Stefan

photo
1

Hello Stefan,

I hope you are doing well, Thank you for providing this screen recording.

Apologies for the delay in response. I have replicated this issue as per your steps and it's working fine in my environment. Could you please provide your thoughts on this.

c1b0b25c93c350f4ba0762b00e266b4a

8314f6adabc5cca3071fb16399ed1c4c

Good Day!

Regards,

Priya Chegudi.

photo
1

Hi Priya,

strange. I analyzed it further and found the problem:

  • if you activate the option "QuickInfo formatting" (2) in the chart settings "Data series" (1), you get the wrong format displayed, although the column in the table is formatted correctly.
  • if I deactivate the option it is displayed correctly.

It can't be correct like this. I had a similar behavior with percentages. These were displayed correctly as percentages in the table and in the chart (e.g. 20%). When I selected multiple values, the percentage value became 0.25.


The function seems incorrect to me.

;) Stefan

216f06e03f0878a63e911d929e633471

photo
1

Hello Stefan,

I have tried this in my environment after enabling the Tool formatting option the data was showing incorrect results.

Could you please confirm us few things here:

  • Is the Tool formatting option should be enabled
  • Is the percentage also facing the same issue because of Tool Formatting?

Please let us know these details to proceed further.

Regards,

Priya Chegudi.

photo
1

Hi Priya,

I can't tell you exactly, I don't know what the option is supposed to do.

I assume that if the column in the table is formatted correctly, this option should be enabled, right? It doesn't seem to be working. A defect...


I don't have an example for % right now, let's fix this defect first.;) Stefan

photo
1

Hello Stefan,

After changing the text formats in Administration > Configuration > Region, we can see that the changes are directly applied to data, and the results displaying correctly. As per this, we don't need this option to be enabled.

If you need this option to be enabled I will raise a defect ticket for this issue.

Please let me know your thoughts on this.

Regards,

Priya Chegudi.

photo
1

Hi Priya,
I don't know if I need this function? What exactly is the function supposed to do?
Once I understand that, I can decide if it is a bug or a feature.

can you help me there, I can't figure it out from the description.

;) Stefan

photo
1

Hello Stefan,

You can check this here for more information. 563e1b8cd354a9d4895c0b6af657327f

Please let us know your thought on this.

Regards,

Priya Chegudi.

photo
1

Hello Stefan,

I hope you are doing well.

I just want to touch base to see if you had a chance to read through my response. If you can let me know that would be great.

Thank you!

Regards,

Priya Chegudi.

photo
1

Hi Priya,

yes, I have read the explanation. When enabled, the formatting is taken from the report. So a dot as thousand separator.

But exactly this does not work, from my point of view clearly an error.

Please mark it as "defect logged"

;) Stefan

photo
1

Hello Stefan,

I hope you are doing well.

I have raised a Defect as per your request for this issue going forward I'm marking this ticket as 'Defect Logged' for now for tracking purposes and will update you once I hear back from the Development team.

Good day!

Regards,

Priya Chegudi.

photo
Leave a Comment
 
Attach a file