
APAC SD Team


NA Business Team
Category
Data Sources
Product Version
7.3
In Times Series chart how is the calculation is done ?
Idea Logged
Hi,
While using timeseries chart, after making time series on, there is an option like series selction style. I have selected to display series selection at the top. Please find the attached image, and clarify me how that calculation is done.
Files:
timeseries.png
 I like this idea
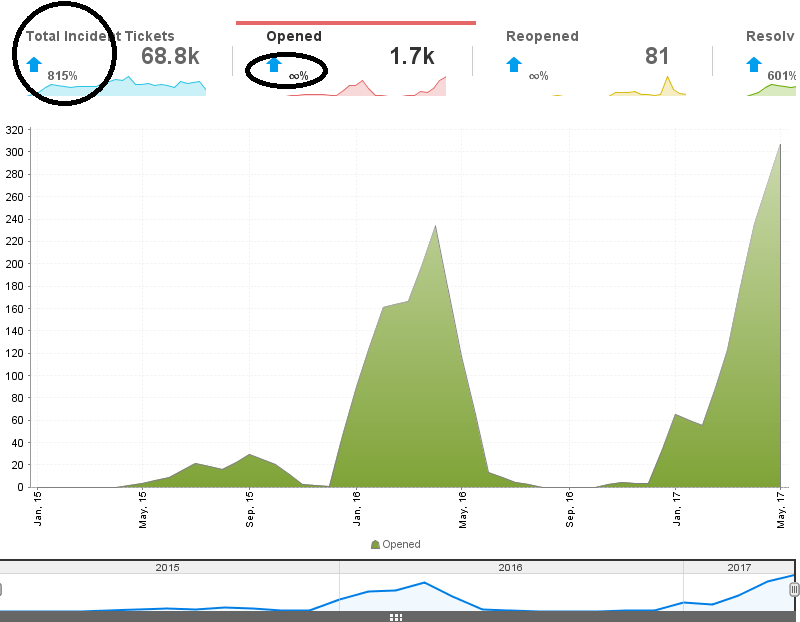
Hi Madhurima,
This percentage is calculated using: (last value - first value )/ last value, for the time period selected. See the screenshot below:
Let me know if this is true for your tests as well!
Regards,
Nathan
Hi Madhurima,
This percentage is calculated using: (last value - first value )/ last value, for the time period selected. See the screenshot below:
Let me know if this is true for your tests as well!
Regards,
Nathan
Hi,
Thanks for the information. May I know is there any other possibility to hide that only " (last value - first value )/ last value" .Instead can I introduce my new calculation.
Hi,
Thanks for the information. May I know is there any other possibility to hide that only " (last value - first value )/ last value" .Instead can I introduce my new calculation.
Hi Madhurima,
Unfortunately this is not possible, however you can use numeric display on a multi-chart canvas to dynamically show whatever value you want.
If this does not work for you we can create an idea to expand the series selection to include the same options that the current chart summary does (where you can disable this variance).
Please let me know how you would like to proceed here!
Regards,
Nathan
Yes, Please do work on it. We don't want variance. instead introduce either new calculation of our own or hide that value.
Yes, Please do work on it. We don't want variance. instead introduce either new calculation of our own or hide that value.
Hi Madhurima,
I have converted this in to an idea so that the product team has a chance to review it for possible future inclusion.
Let me know if you have any questions in the meantime.
Regards,
Nathan
Hi Madhurima,
I have converted this in to an idea so that the product team has a chance to review it for possible future inclusion.
Let me know if you have any questions in the meantime.
Regards,
Nathan
Replies have been locked on this page!