

Thanks :)
One more quick question.
Am I able to add more detail to tool tips in both charts and tables? I can see that it is an option for some charts but not all. I can't seem to see an option for it in the tables wither, I am wanting to display several value in a tool tip on a table, but the have the cell itself on show a single value.
Is this possible?
Cheers,
L
Lisa Wood | Senior Analyst | Analytics and Performance
Victorian Public Sector Commission | 3 Treasury Place Melbourne Victoria 3002
p. 03 9651 0618 | e. lisa.wood@vpsc.vic.gov.au | www.vpsc.vic.gov.au
The VPSC offices are located on the land of the Traditional Owners, the people of the Kulin Nations. We acknowledge their history, culture and Elders both past and present.
From: simone clancy
To: Lisa Wood/VPSC/VICGOV/AU@DPC,
Date: 18/04/2017 10:54 AM
Subject: Re: Charts [SEC=UNCLASSIFIED]
Hi Lisa,
I would have thought so. Unfortunately I’m not in the office today so can’t ask. I have forwarded to support for review and a response. Please let me know if don’t don’t hear from them within a couple of days.
Haven’t forgotten about your other items either - I am following up for a response to you.
Best,
Simone
On 18 Apr. 2017, at 10:33 am, lisa.wood@vpsc.vic.gov.au wrote:
Hi Simone,
I was just wondering if there was a way to round a figure in the data and not just in the display (as in formatting applied to the data is used by any/all conditions, calculations and charts and not just for display purposes).
The issue I am having is with a bar chart. I have my numbers round to no decimal places. This shows on the label, but the bars in the chart are formatting themselves based on the underlying data.
I can't round in a freehand SQL as it does not allow any aggregate functions there so not really sure where else I am able to do this.
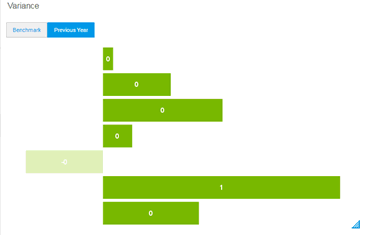
Example below. The actual values are range from about .2 to .8, but I am only interested in the rounded number. I have formatted it this way in the table used by this chart, however the chart sees the actual values so I am getting the below instead on them all being on zero with the exception of one. The users of this do not want decimals. Is there a way to get the chart to chart the rounded numbers? I have tried to set the scale for the chart but this doesn't seem to work either
Cheers,
L
Lisa Wood | Senior Analyst | Analytics and Performance
Victorian Public Sector Commission | 3 Treasury Place Melbourne Victoria 3002
p. 03 9651 0618 | e. lisa.wood@vpsc.vic.gov.au | http://www.vpsc.vic.gov.au
The VPSC offices are located on the land of the Traditional Owners, the people of the Kulin Nations. We acknowledge their history, culture and Elders both past and present.
 I like this idea
Thanks :)
One more quick question.
Am I able to add more detail to tool tips in both charts and tables? I can see that it is an option for some charts but not all. I can't seem to see an option for it in the tables wither, I am wanting to display several value in a tool tip on a table, but the have the cell itself on show a single value.
Is this possible?
Cheers,
L
Lisa Wood | Senior Analyst | Analytics and Performance
Victorian Public Sector Commission | 3 Treasury Place Melbourne Victoria 3002
p. 03 9651 0618 | e. lisa.wood@vpsc.vic.gov.au | www.vpsc.vic.gov.au
The VPSC offices are located on the land of the Traditional Owners, the people of the Kulin Nations. We acknowledge their history, culture and Elders both past and present.
From: simone clancy
To: Lisa Wood/VPSC/VICGOV/AU@DPC,
Date: 18/04/2017 10:54 AM
Subject: Re: Charts [SEC=UNCLASSIFIED]
Hi Lisa,
I would have thought so. Unfortunately I’m not in the office today so can’t ask. I have forwarded to support for review and a response. Please let me know if don’t don’t hear from them within a couple of days.
Haven’t forgotten about your other items either - I am following up for a response to you.
Best,
Simone
On 18 Apr. 2017, at 10:33 am, lisa.wood@vpsc.vic.gov.au wrote:
Hi Simone,
I was just wondering if there was a way to round a figure in the data and not just in the display (as in formatting applied to the data is used by any/all conditions, calculations and charts and not just for display purposes).
The issue I am having is with a bar chart. I have my numbers round to no decimal places. This shows on the label, but the bars in the chart are formatting themselves based on the underlying data.
I can't round in a freehand SQL as it does not allow any aggregate functions there so not really sure where else I am able to do this.
Example below. The actual values are range from about .2 to .8, but I am only interested in the rounded number. I have formatted it this way in the table used by this chart, however the chart sees the actual values so I am getting the below instead on them all being on zero with the exception of one. The users of this do not want decimals. Is there a way to get the chart to chart the rounded numbers? I have tried to set the scale for the chart but this doesn't seem to work either
Cheers,
L
Lisa Wood | Senior Analyst | Analytics and Performance
Victorian Public Sector Commission | 3 Treasury Place Melbourne Victoria 3002
p. 03 9651 0618 | e. lisa.wood@vpsc.vic.gov.au | http://www.vpsc.vic.gov.au
The VPSC offices are located on the land of the Traditional Owners, the people of the Kulin Nations. We acknowledge their history, culture and Elders both past and present.
Hi,
Was there supposed to be further information there yet? All I can see is my original email.
Cheers,
L
Lisa Wood | Senior Analyst | Analytics and Performance
Victorian Public Sector Commission | 3 Treasury Place Melbourne Victoria 3002
p. 03 9651 0618 | e. lisa.wood@vpsc.vic.gov.au | www.vpsc.vic.gov.au
The VPSC offices are located on the land of the Traditional Owners, the people of the Kulin Nations. We acknowledge their history, culture and Elders both past and present.
From: Yellowfin Support
To: Lisa Wood/VPSC/VICGOV/AU@DPC,
Date: 18/04/2017 11:48 AM
Subject: Notification on "Fwd: Charts "
Notification
Hi, Lisa Wood
Big Dave wants you to check following ticket in Yellowfin Community:
Fwd: Charts
OPEN ticket IN BROWSER
ticket: Fwd: Charts
Status: New
Category: -
Assigned: None
Stop receiving notifications about this ticket
Hi Lisa,
Sorry for confusion, that email was system generated, please ignore it.
We are looking into this ticket and will reply back to you.
Regards,
Mahe
Hi Lisa,
Sorry for confusion, that email was system generated, please ignore it.
We are looking into this ticket and will reply back to you.
Regards,
Mahe
Hi Lisa,
I am answering you questions below:
1. Am I able to add more detail to tool tips in both charts and tables?
Sorry, this option is not available.
2. I can see that it is an option for some charts but not all. I can't seem to see an option for it in the tables wither,
Yes, you are correct, there is no option for table.
3. I am wanting to display several value in a tool tip on a table, but the have the cell itself on show a single value.
Can you please draw an example and email me, I will discuss with the team and if feasible, i will raise as an enhancement request.
Please let me know if you have any more questions.
Regards,
Mahe
Hi Lisa,
I am just doing a followup email as I haven't heard back from you.
Please let me know if you have any questions.
I will close this ticket, you can still reply back on this ticket.
Regards,
Mahe
Hi Lisa,
I am just doing a followup email as I haven't heard back from you.
Please let me know if you have any questions.
I will close this ticket, you can still reply back on this ticket.
Regards,
Mahe
Hi Mehe,
I didn't respond further as it seemed pretty clear that the tool cannot do any of the things I needed it to in regards to tooltips.
I would hope that this would already be on enhancement list as the point of a tool tip is to show extra information, not to just display the value that is already visible, as this is kind of pointless and redundant.
L
Lisa Wood | Senior Analyst | Analytics and Performance
Victorian Public Sector Commission | 3 Treasury Place Melbourne Victoria 3002
p. 03 9651 0618 | e. lisa.wood@vpsc.vic.gov.au | www.vpsc.vic.gov.au
The VPSC offices are located on the land of the Traditional Owners, the people of the Kulin Nations. We acknowledge their history, culture and Elders both past and present.
From: Mahe Thatipamula
To: Lisa Wood/VPSC/VICGOV/AU@DPC,
Date: 31/05/2017 11:37 AM
Subject: Re: Questions on Charts Tool tips [#2316]
Hi Lisa,
I have created an enhancement request 6083 to make it flexible to add the required fields into the tooltips for the Table and the Charts.
Also just want to let you know that in 7.3+ we have introduced Javascript charts, which needs bit of coding but it's more flexible and you can build charts as per your requirements.
Please click here for more information.
Click here for Wiki page.
Please let me know if you have any questions.
Regards,
Mahe
Replies have been locked on this page!