
APAC SD Team

Category
Report Builder
Product Version
7.2
Add Plot Values on Line Charts
Completed
It would be great to have a way to display the values of data points on line charts. This would be a good option for those who want to see the specific values of a data point without having to mouse-over it to bring up the tooltip.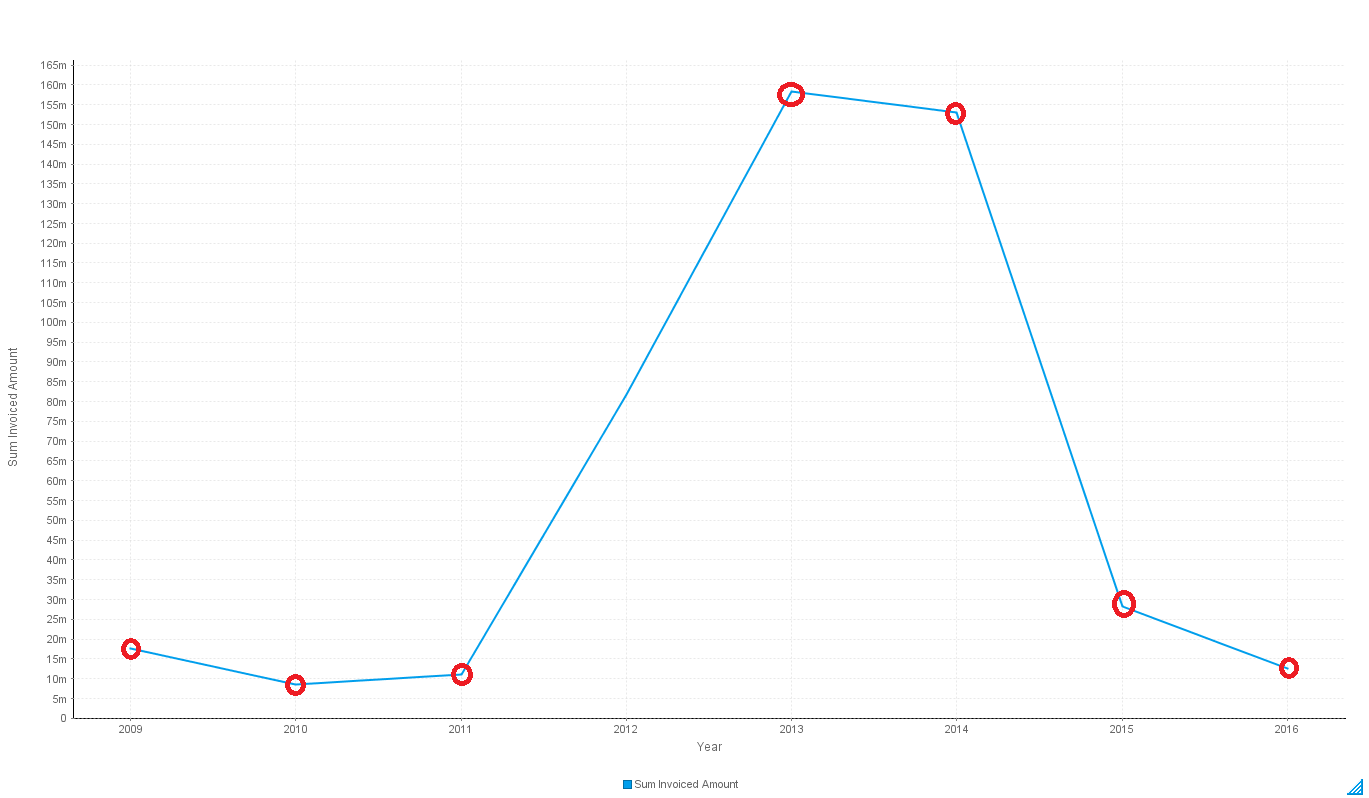
 I like this idea
This has been submitted as a product enhancement, though no ETA can be given at this point in time when it can be implemented.
This has been submitted as a product enhancement, though no ETA can be given at this point in time when it can be implemented.
Marking this as Completed.
This is now an option within Yellowfin, having tested this in 9.10.0.1
NOTE: This was introduced within 7.3 and 7.3.
Marking this as Completed.
This is now an option within Yellowfin, having tested this in 9.10.0.1
NOTE: This was introduced within 7.3 and 7.3.
Replies have been locked on this page!